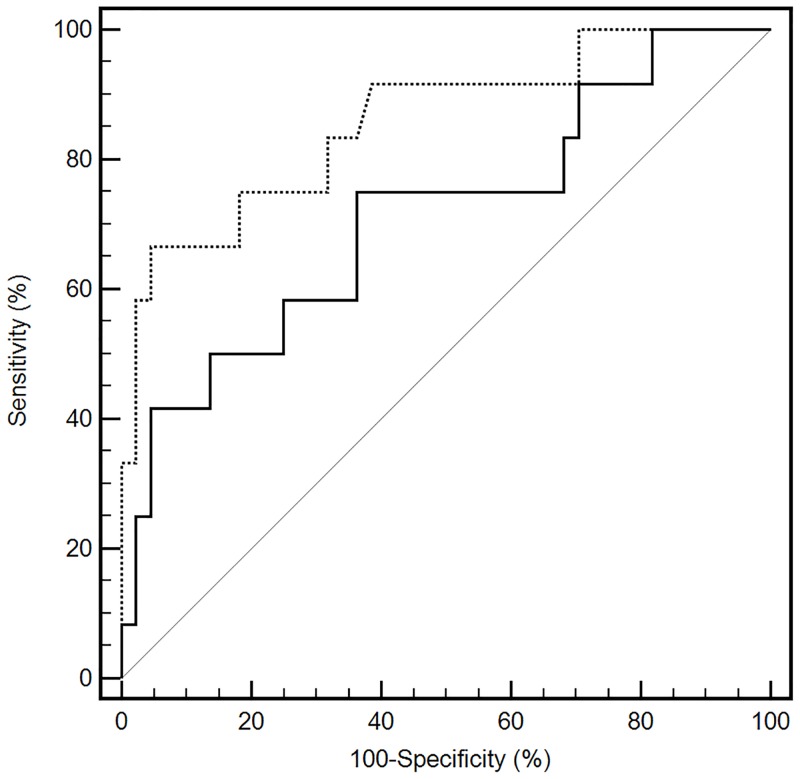
Fig 2. Receiver operating characteristic curves of the HOMA-Adiponectin and HOMA-IR for detecting insulin resistance.
The dashed line represents the HOMA-IR (homeostasis model assessment of insulin resistance), and solid line represents the HOMA-Adiponectin (homeostasis model assessment of adiponectin). The solid grey line is the reference and it represents an AUC of 0.5.

