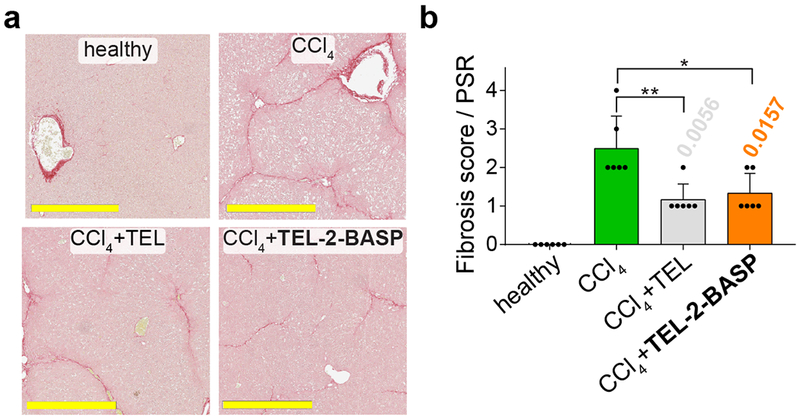
Figure 6. Assessing fibrosis reversal with PicroSirus Red histological images.

a. PicroSirus Red (PSR) stained images (from a representative animal challenged with CCl4) reveals an overall reduction of fibrosis upon treatment of TEL-2-BASP. For full sets of PSR stained histological images from three separate groups of animals (out of 6 random animals that were analyzed per group), see Figures S24 – S26 (full liver images) and Figures S27 – S29 (magnified liver images). Scale bars = 500 μm. b. Visualization of fibrosis scores (PSR) of healthy, diseased (CCl4), and treated (TEL or TEL-2-BASP) animals (n = 6 random animals analyzed & scored per group). Data reported as mean ± SD, statistical analyses performed with two-tailed Student’s t test (* = P < 0.05, ** = P < 0.01). Individual P values are noted above each bar when statistical differences are present.
