FIGURE 4.

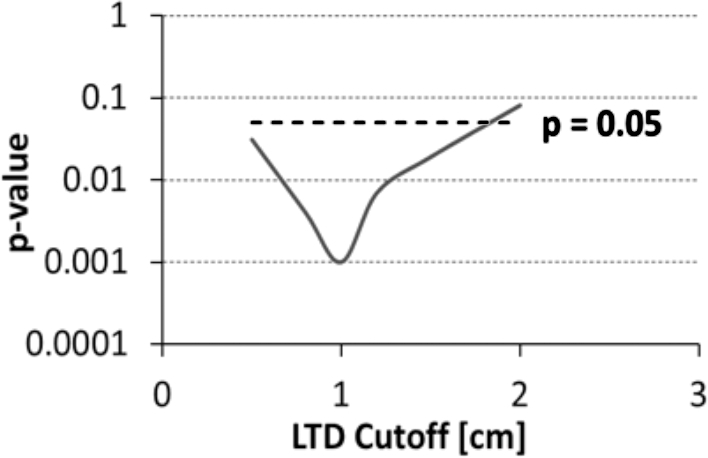
P-values (plotted logarithmically in the vertical axis of the figure) of left SLF LTD as a function of LTD cutoff value used as threshold for defining low vs high SLF LTD when comparing the rate of new surgical deficits.

P-values (plotted logarithmically in the vertical axis of the figure) of left SLF LTD as a function of LTD cutoff value used as threshold for defining low vs high SLF LTD when comparing the rate of new surgical deficits.