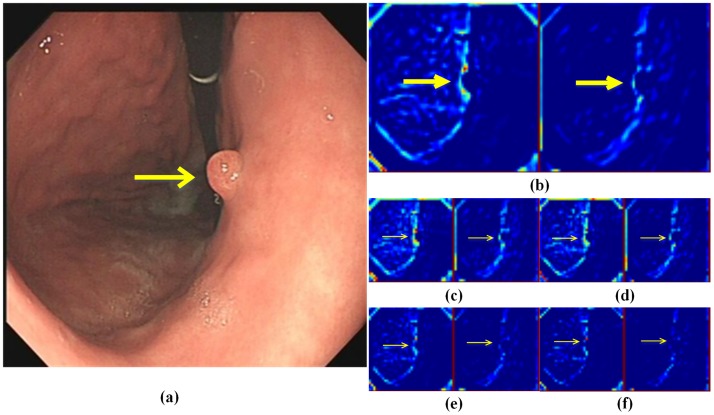
Fig 2. An example to explain that Max-Pooling may cause useful information to be lost.
(a) represents an original gastric image with a polyp. (b) denotes two feature maps extracted from Conv3_3 layer. (c), (d), (e), and (f) are maps obtained from (b) using different pooling methods, namely Max-Pooling, Second Max-Pooling, Second Min-Pooling, and Min-Pooling. The yellow arrows denote the polyp location. All the feature maps are pseudo color maps for visualization.

