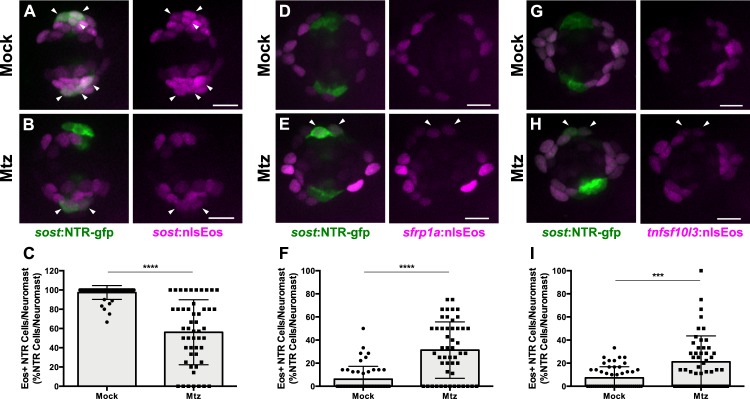
Figure 11. DV cells are replenished by other support cell populations.
(A–B, D–E, G–H) Maximum projections of neuromasts expressing sost:NTR-GFP and sost:nlsEos (A–B), sfrp1a:nlsEos (D–E), and tnfsf10l3:nlsEos (G–H) in the absence of (A, D, G; Mock) or following Mtz-induced DV cell ablation (B, E, H; Mtz). Sost:NTR-GFP cells are shown in green and nlsEos-positive cells are shown in magenta. Arrowheads indicate nlsEos-positive sost:NTR-GFP cells. Scale bar = 10 μm. (C) Percentage of sost:NTR-GFP cells per neuromast labeled by sost:nlsEos following DV cell regeneration. Mock: 97.39 ± 7.14, n = 50 neuromasts (10 fish); Mtz: 56.09 ± 33.72, n = 50 neuromasts (10 fish); mean ± SD; Mann Whitney U test, p<0.0001. (F) Percentage of sost:NTR-GFP cells per neuromast labeled by sfrp1a:nlsEos following DV cell regeneration. Mock: 6.15 ± 11.14, n = 50 neuromasts (10 fish); Mtz: 31.27 ± 24.41, n = 50 neuromasts (10 fish); mean ± SD; Mann Whitney U test, p<0.0001. (I) Percentage of sost:NTR-GFP cells per neuromast labeled by tnfsf10l3:nlsEos following DV cell regeneration. Mock: 7.31 ± 9.55, n = 50 neuromasts (10 fish); Mtz: 21.11 ± 22.51, n = 50 neuromasts (10 fish); mean ± SD; Mann Whitney U test, p=0.0004.


