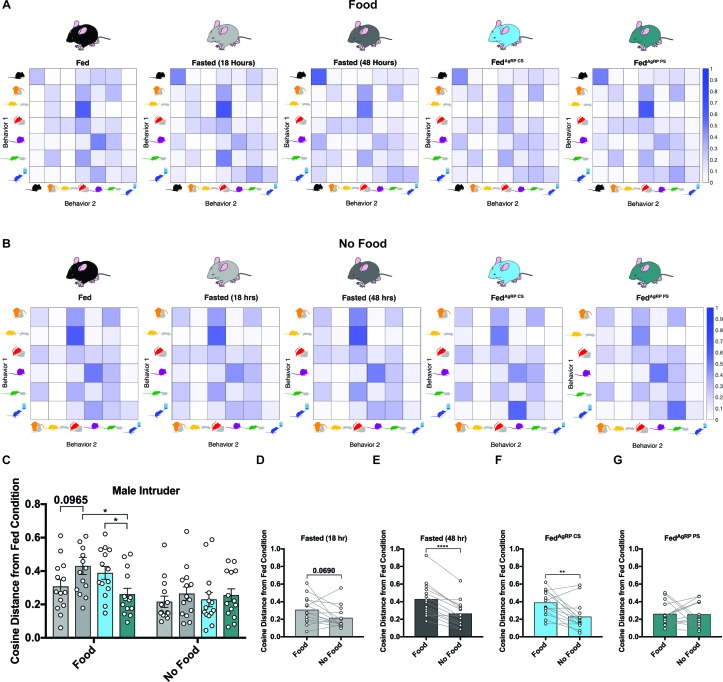
Figure 6. Behavioral sequence analyses of resident males exposed to a male intruder.
(A–B) Transition matrices of behavioral transitions grouped by appetite condition in the presence (A) or absence (B) of food. (C) Quantified between-subject comparisons of the cosine distance from the Fed condition in the presence or absence of food, respectively. (D–G) Quantified within-subject comparisons of the cosine distance from the Fed condition in the presence versus absence of food. n = 16 per group, values are means ± SEM. *p<0.05, **p<0.01, ***p<0.001.

