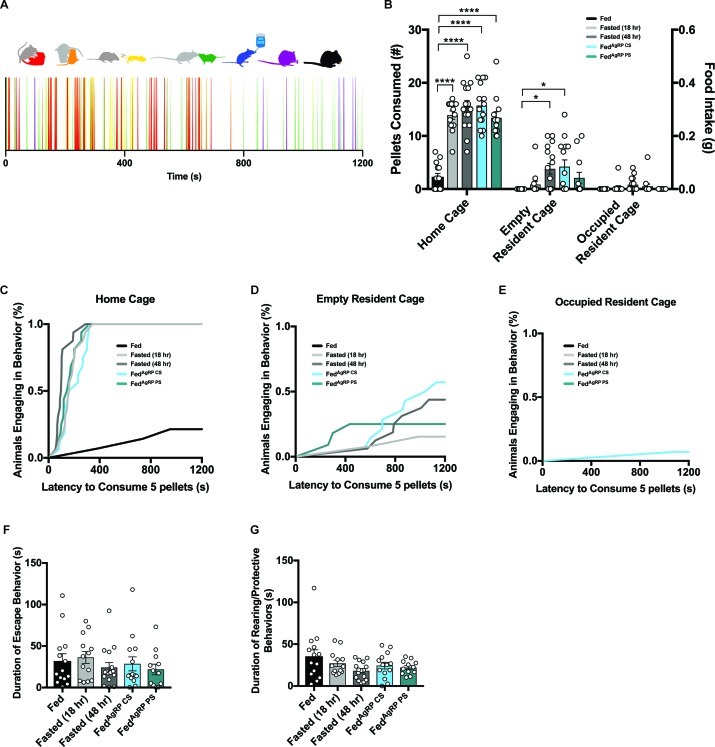
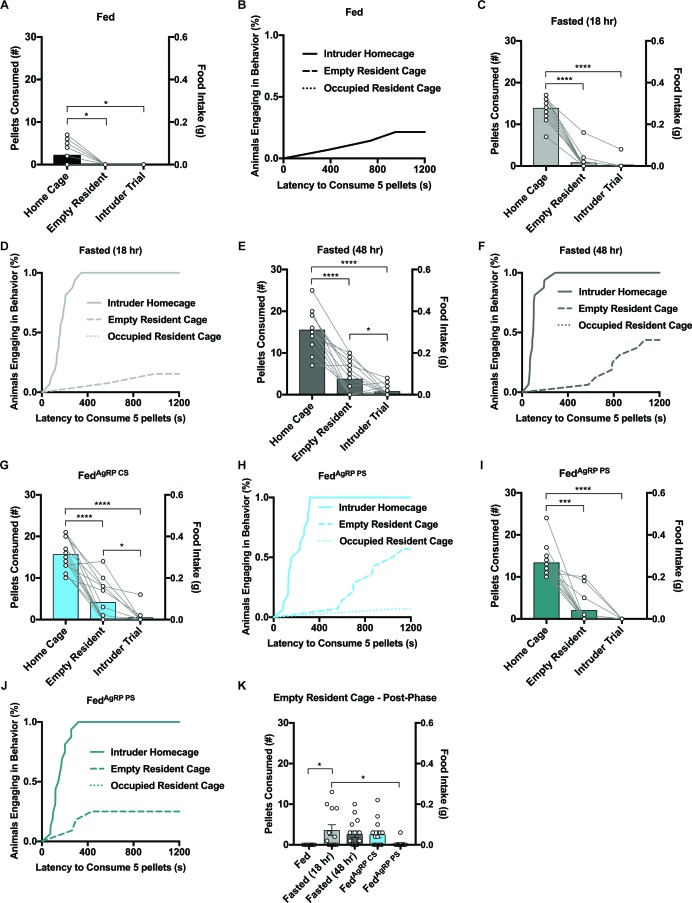
Figure 7. Evaluating male intruder behavior in response to a dominant male resident.
(A) Catalogue of scored male intruder behaviors (top); defensive posturing such as rearing and being pinned (red), flight comprising of escape/jumping (yellow), anogenital chemoinvestigation (orange), nose-to-nose chemoinvestigation (green), drinking (blue), grooming (purple) and eating (black). Sample raster plot of second-to-second scored behaviors across the entire Trial Phase (bottom). (B–E) Quantified between-subject comparisons of male intruder food intake (B) and cumulative latency plot to consume 0.1 grams of food in the intruder homecage (C), empty resident cage (D) or occupied resident cage (E). Quantified between-subject comparisons of male intruder escape (F) and defensive (G) behaviors. n = 14 Fed group, n = 13 Fasted (18 hr) group, n = 16 Fasted (48 hr) group, n = 14 FedAgRP CS group, n = 12 FedAgRP PS group. values are means ± SEM. *p<0.05, **p<0.01, ***p<0.001.


