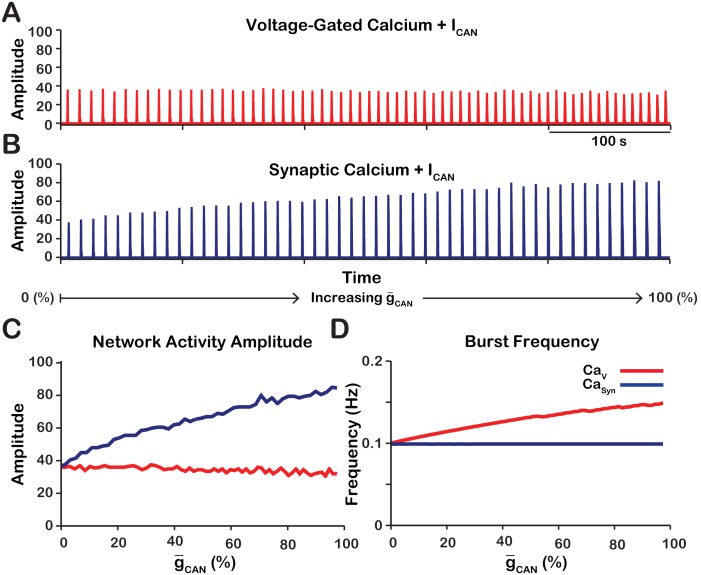
Figure 1. Manipulations of in the and networks produce opposite effects on network activity amplitude (spikes/s) and frequency.
(A and B) Histograms of neuronal population activity amplitude in the , and networks with linearly increasing . (C) Plot of (% of the baseline mean value for the simulated population) vs. network activity amplitude for the and networks in A and B. (D) Plot of (%) vs. network frequency for the and networks in A and B. network parameters: , , and . network parameters: , , and .

