
Figure 11. Comparison of experimental (black) and simulated (red) TRPC3 blockade (by block) on network activity amplitude (A) and frequency (B).
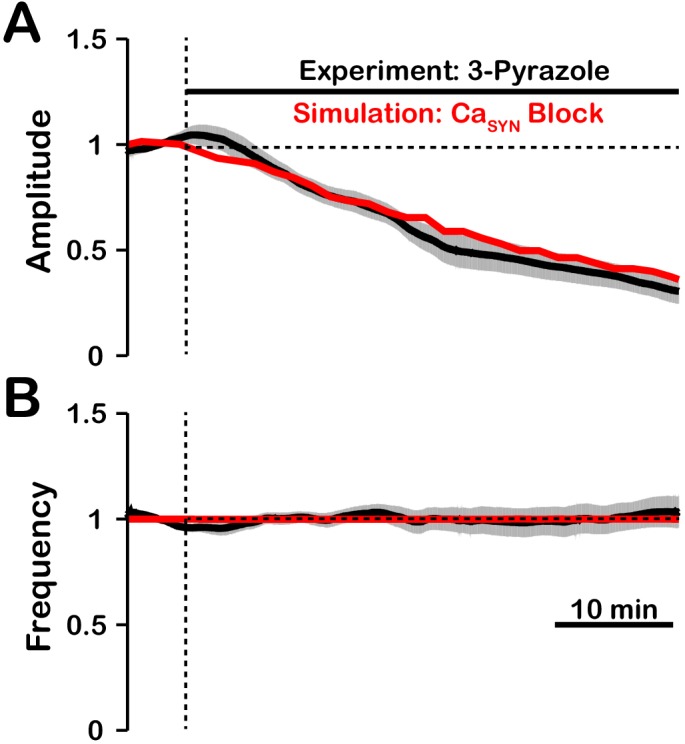
Simulated and experimental blockade begins at the vertical dashed line. The black line represents the mean and the gray band represents the S.E.M. of experimental integrated XII output recorded from neonatal rat brainstem slices in vitro, reproduced from Koizumi et al., 2018. Blockade was simulated by exponential decay of with the following parameters: 3-pyrazole: , . The network parameters are: , , and .