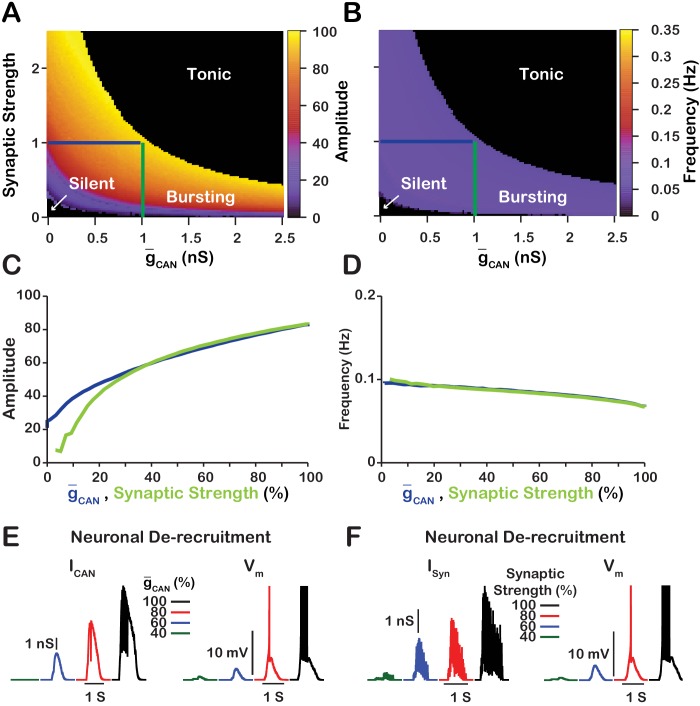
Figure 4. Manipulations of synaptic strength () and have equivalent effects on network activity amplitude, frequency and recruitment of inspiratory neurons not involved in rhythm generation.
(A and B) Relationship between (mean values for the simulated populations), synaptic strength and the amplitude and frequency in the network. Notice the symmetry about the X=Y line in panels A and B, which, indicates that changes in and or synaptic strength are qualitatively equivalent. Synaptic strength was changed by varying . (C) Relationship between network activity amplitude and the reduction of (blue) or synaptic strength (green). (D) Relationship between network frequency and the reduction of (blue) or synaptic strength (green). (E and F) Decreasing or synaptic strength de-recruits neurons by reducing the inspiratory drive potential, indicated by the amplitude of subthreshold depolarization, right traces. The solid blue and green lines in panels A and B represent the location in the 2D parameter space of the corresponding blue and green curves in C and D. The action potentials in the right traces of E and F are truncated to show the change in neuronal inspiratory drive potential. The parameters used for these simulations are : , , and .

