
Figure 2.
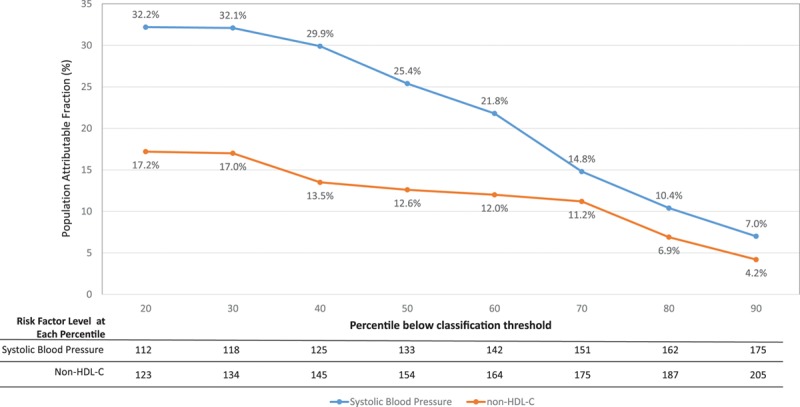
Population attributable fraction (PAF) for blood pressure and lipids as a function of percentage of individuals below the classification threshold. The 2 curves present PAFs as a function of risk factor level threshold (ie, the percentage of coronary heart disease risk that could be eliminated if systolic blood pressure [SBP] or non–high-density lipoprotein cholesterol levels never exceeded the numbers given in the table at the bottom [which correspond to the percentiles of risk factor distribution in our sample]). For example, the PAF associated with keeping SBP <125 mm Hg (40th percentile) is 29.9%, but it drops to 21.8% for SBP <142 mm Hg (60th percentile).