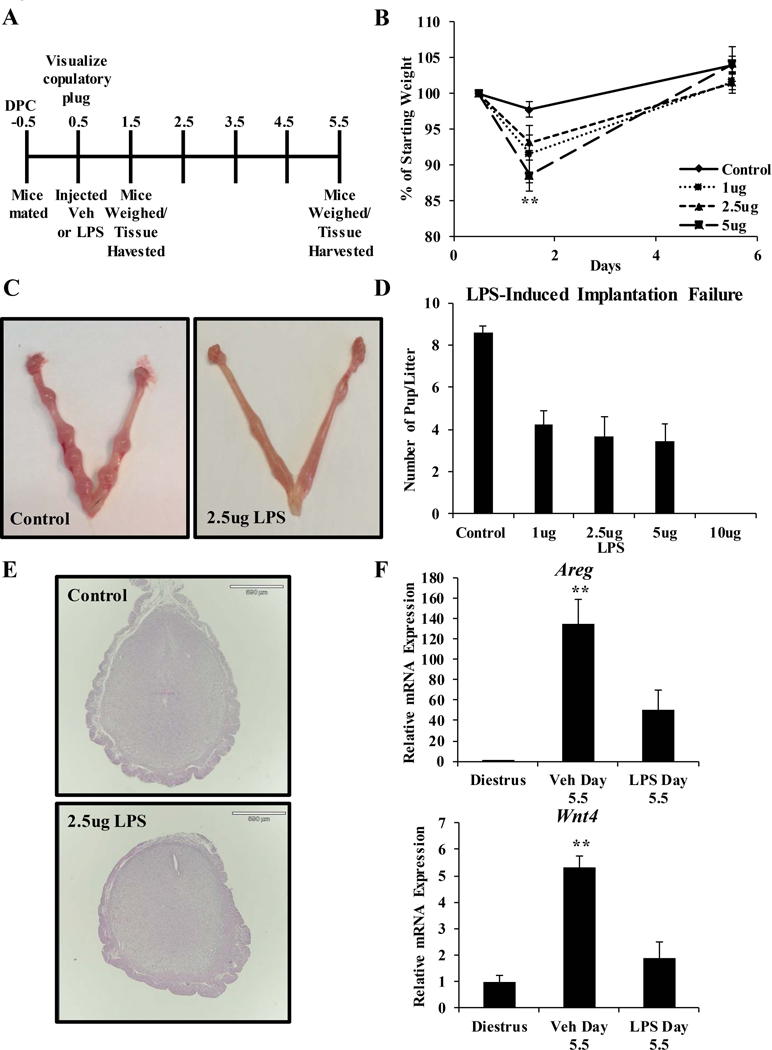
Figure 1. LPS-induced implantation failure.

(A) Schematic of the LPS exposure regimen is shown. Mice were injected with saline or various concentrations of LPS diluted in saline on the day the copulatory plug was visualized (0.5 days post coitum; dpc). Mice received a total injection volume of 100 μl by intraperitoneal injection. Mice were weighed on 0.5, 1.5, and 5.5 dpc. Uterine tissue was harvested on 1.5 and 5.5 dpc. (B) Mice were weighed immediately prior to injection, 1 day post-injection, and 5 days post-injection. Body weight relative to starting body weight is graphed. (C) Representative images of uterine horns from vehicle and LPS (2.5 μg) treated mice on 5.5 dpc. (D) Implantation sites were counted on 5.5 dpc in all treatment groups and the average per group was graphed. (E) Gross examination of uterine histology in mice treated with vehicle or 2.5 μg LPS. Cross-sections were stained with hematoxylin and eosin. (F) Transcript levels of decidual biomarkers Areg and Wnt4 were measured by qRT-PCR in mouse uterine RNA samples harvested from diestrus staged mice and 5.5 dpc mice treated with vehicle (saline) or 2.5 μg LPS. Transcript levels were normalized to the reference gene Ppib and set relative to vehicle samples. Results are representative of at least 4 independent experiments. Data represent the mean ± SEM, **p < 0.01 as determined by ANOVA.
