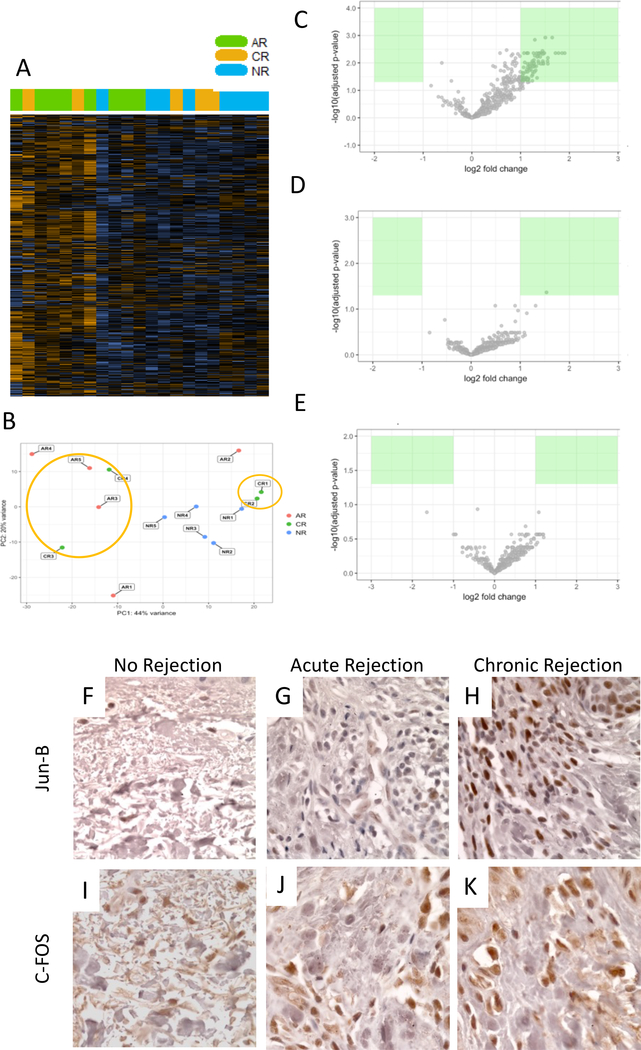
Fig. 3:
Unsupervised clustering shows separation of AR and NR, and mixed distribution of CR (A). Principal component analysis indicates clustering of some CR specimen with AR and some with NR (B) suggesting partial acute on chronic presentation. Gene expression pointed distinct expression patterns in subsequent analysis; c-Fos (FOS) suggestive as marker for CR (C-E). IHC for c-Fos and JunB confirmed increased expression in CR samples (F-K).

