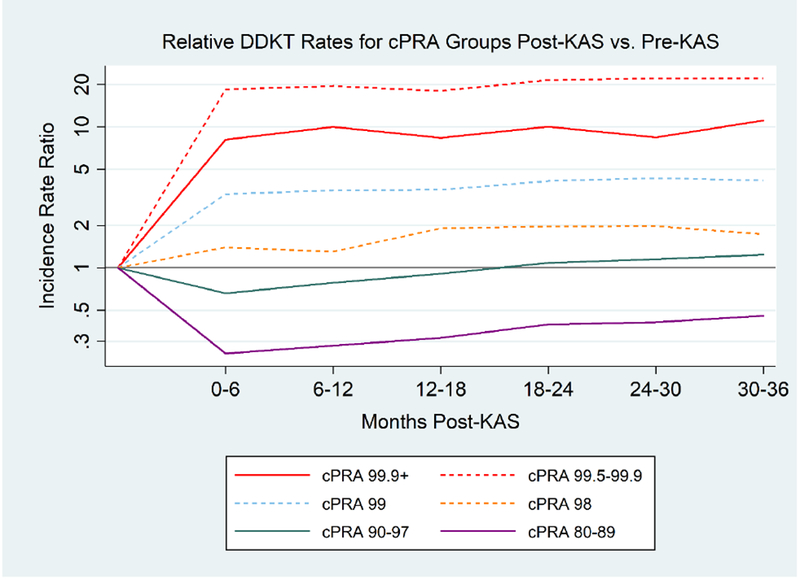
Figure 2.

Relative DDKT# Rates for Different cPRA* Groups Post-KAS Compared to Pre-KAS
KAS has produced sustained changes to DDKT rates for most cPRA categories. Three years post-KAS, cPRA 99.9%+, 99.5-99.9%, 99%, and 98% candidates have increased DDKT rates compared to pre-KAS. Conversely, cPRA 80-89% candidates have lower DDKT rates post-KAS compared to pre-KAS.
#DDKT, deceased donor kidney transplantation; *cPRA, calculated panel reactive antibody
Grey horizontal line represents an incidence rate ratio of 1, which would represent equivalent DDKT rates post-KAS compared to pre-KAS
