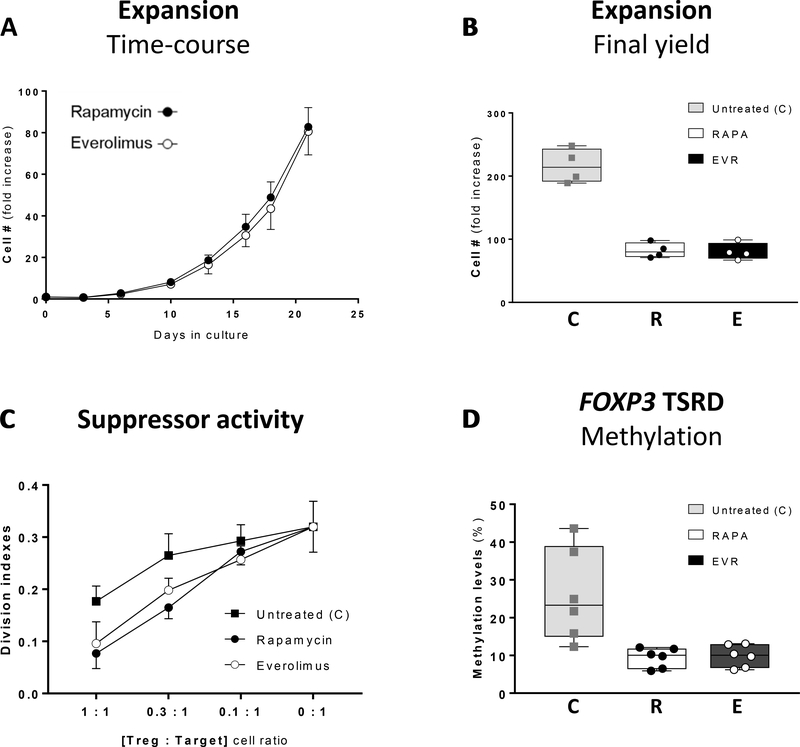
Figure 5. Long-term effect of rapamycin and everolimus on the expansion, FOXP3 TSDR methylation, suppressor function and phenotype of Treg cells.
CD4+CD25+ cells were expanded in Treg expansion medium in the presence of 100nM RAPA or 100 nM EVR for 21 days. (A) Cell numbers for RAPA (closed circles) or EVR (empty circles)-treated cells were quantified every 2–4 days. The plot illustrates the temporal fold increase in cell numbers with respect to the initial seeding. (B) Cell yield corresponding to the 21-day expansion in untreated (C), RAPA-treated (R), or EVR-treated (E) cells shown as interquartile (25/75) range box-and-whiskers plots with median and individual values of n=4 measurements. (C) Suppressive activity induced in allogeneic CFSE-labeled responder T cells in co-culture for 72 hours with different of Treg:Target labeled cell ratios. Suppressor activity was measured by the decrease of division indexes in the CFSE-labeled target cells. (D) Methylation status (as percentage) of the TSDR FOXP3 in untreated (C), RAPA-treated (R), or EVR-treated (E) cells is shown as interquartile range box-and-whiskers plots with median and individual values of n=6 measurements.

