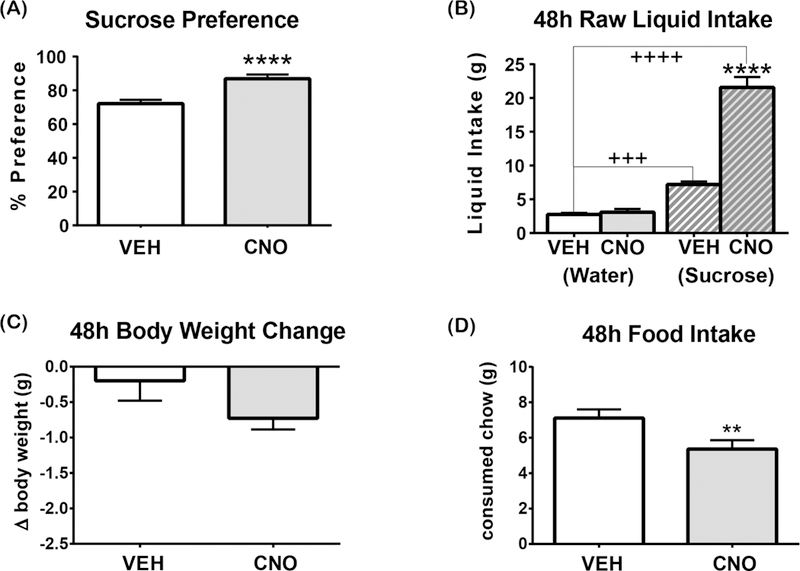
Figure 6. Sucrose preference is increased when LHA Nts neurons are activated.

Graphed data shows the mean ± SEM, n=7. 48-hour 2-bottle preference test in which one bottle contains water and the other contains 1% sucrose. All statistical tests are two-tailed paired t-test with alpha: 0.05. (A) Sucrose preference, ****p<0.0001. [ t(6)=16.48, p<0.0001] (B) 1% sucrose intake [t(6)=11.74 , p<0.0001] and water intake [t(6)=1.202, p=0.2746]. VEH-induced water vs1% sucrose solution consumption: t(6)=8.955, p=0.0001. CNO-induced water vs 1% sucrose solution consumption: t(6)=9.896, p<0.0001. (C) Body weight change in 48 hours, [t(6)=1.584, p=0.1642]. (D) Food intake [ t(6)=4.822, p=0.0029]. “+” indicates significant difference between the consumption of different liquids with the same treatment and “*” indicates significant difference in consumption of the same liquid between different treatments. **p<0.01, ****p<0.0001, +++p<0.001, ++++p<0.0001.
