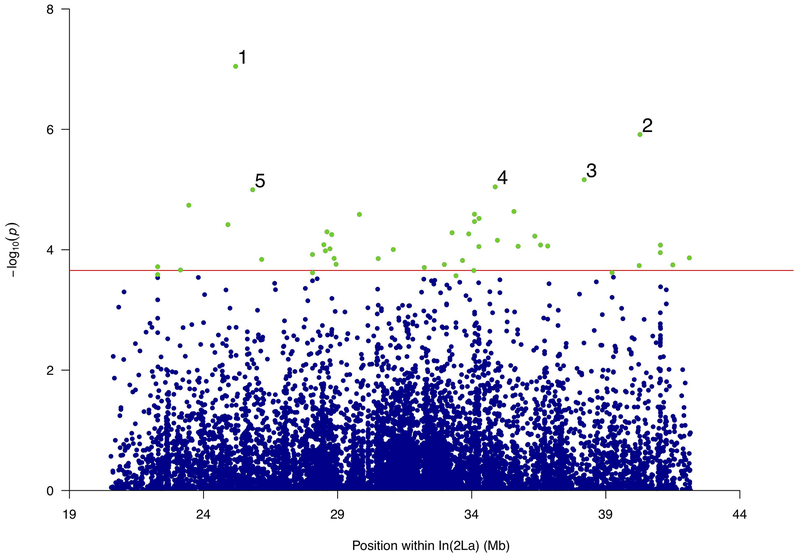
Figure 3.
Manhattan plot of the association P-values for acute desiccation tolerance inside In(2La). Horizontal red line represents the In(2La)-wide significance threshold at FDR of 5% (P < 0.00027). Tested SNPs below that threshold shown as blue dots; green dots represent significant SNPs conferring high tolerance. The SNPs with the lowest P-values are numbered, and correspond to genomic coordinates closest to the following genes: (1) AGAP006026, (2) AGAP006961, AGAP006962, AGAP006963, (3) AGAP006785, AGAP006786, (4) AGAP006633, (5) AGAP006059.

