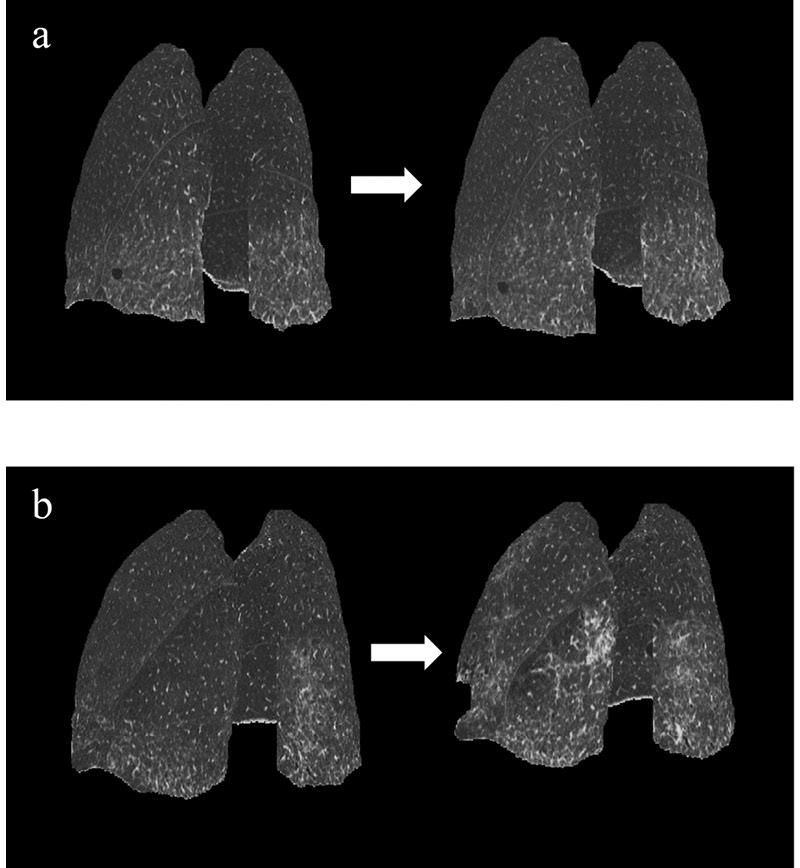
Fig. 3. Initial and follow-up 3D-cHRCT images of representative stable and progressive ILD based on visual evaluation.

Posterolateral views of initial and follow-up 3D-cHRCT in (a) visually stable ILD and (b) visually progressive ILD. (a) Follow-up duration was 358 days. TA ratio of follow-up to initial = 1.01; HAA ratio = 1.08; %HAA ratio = 1.07. (b) Follow-up duration was 166 days. TA ratio of follow-up to initial = 0.869; HAA ratio = 1.48; %HAA ratio = 1.70.
3D-cHRCT, three-dimensional curved high-resolution computed tomography; HAA, high attenuation area; ILD, interstitial lung disease; TA, total area
