
Figure 7.
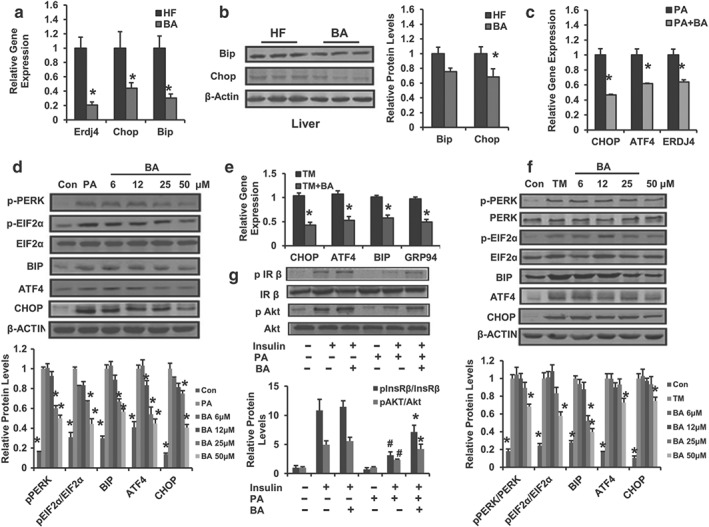
Betulinic acid alleviates hepatocellular ER stress. (a) Relative mRNA expression of hepatic Erdj4, Bip, and Chop in DIO mice with or without betulinic acid treatment. (b) Liver Bip and Chop protein levels were detected with immunoblotting. The relative protein level is shown and normalized to β‐actin. Data are presented as means ± SEM (n = 6). *P < 0.05 versus HFD (HF) group. HepG2 cells were pretreated with betulinic acid at indicated doses for 12 hr, followed by 24 hr stimulation with TM (2.5 μg·ml−1) or PA (500 μM) to induce ER stress, cells treated with DMSO or BSA were used as a negative control. (c, e) Relative mRNA levels of ER stress markers in HepG2 cell in the presence or absence of (TM or PA) challenge were analysed. Cells were incubated with betulinic acid (25 μM) for 24 hr. (d, f) PERK/EIF2α signalling was analysed by immunoblotting with indicated antibody in TM or PA‐challenged HepG2 cell with or without betulinic acid (6, 12, 25, and 50 μM). The relative protein levels are shown and normalized to β‐actin. Data are presented as means ± SEM (n = 6). *P < 0.05 versus PA or TM group. (g) The phosphorylation of insulin receptor β/total insulin receptor β and phosphorylation of Akt/total Akt. The immunoblotting was performed using HepG2 cells in the presence or absence of 24 hr PA and/or betulinic acid (50 μM) pretreatment followed by 30 min DMSO (0.1%) or insulin (100 nM) stimulation. The relative protein level is shown and normalized to total InsRβ or total Akt. Data are statistically analysed as means ± SEM (n = 6). *P < 0.05, insulin + PA + betulinic acid group versus insulin + PA group or # P < 0.05, insulin + PA group versus insulin group. β‐Actin was used for loading control. Data are statistically analysed as means ± SEM (n = 6). The relative protein levels for all western blot images were shown. *P < 0.05 versus HF group. *P < 0.05 versus PA or TM group