Figure 8.

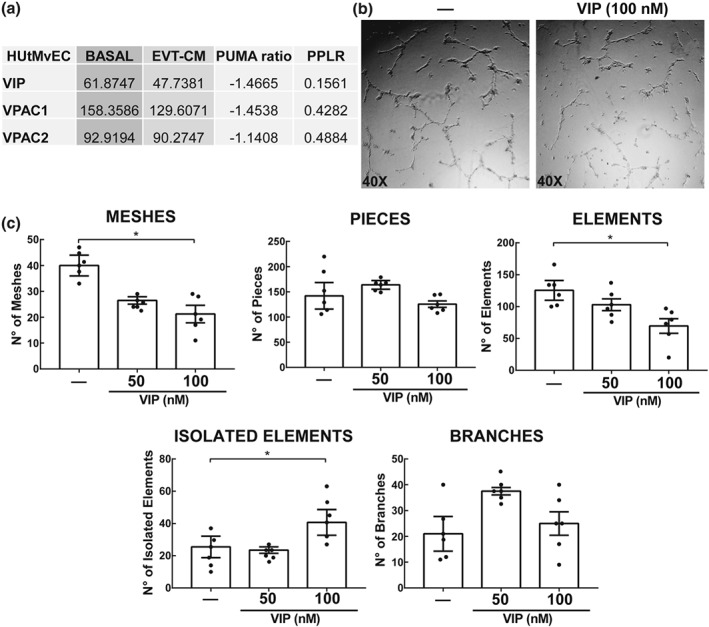
Expression of the VIP/VPAC system in endothelial cells and its effect on tube formation. (a) 1 × 10⁵ HUtMvEC (EC) were cultured in 1:1 mixture of serum‐free EBM‐2 and either DMEM:F12 or EVT‐CM for 24 hr. The RNA was used for Affymetrix Human Genome U133 Plus 2.0 microarray. Expression intensity is measured in arbitrary units. Positional update and matching algorithm (PUMA) ratio (fold change) represents expression from control to treated cells. The PPLR score represents confidence in the observed changes, where PPLR score of 0.9 or 0.1 indicates a significant up‐regulation or down‐regulation respectively (n = 5). (b) 2 × 10⁴ ECs cultured for 8 hr in a Geltrex matrix without or with VIP (50 or 100 nM). Representative microphotographs of EC tube formation ±100 nM VIP (n = 6). (c) Parameters obtained from Angiogenesis Analyser, ImageJ. Each point depicted represents an independent sample. The results are expressed as mean ± SEM of the number of parameter (meshes, pieces, elements, isolated elements, and branches) in macrophages (GM‐CSF). One‐way ANOVA and post hoc Dunn's test were used to compare the results (n = 6). CM: conditioned medium; EBM‐2: EC growth basal medium 2; EC: endothelial cells; EVT: extravillous trophoblast; MA: macrophages; PPLR: probability of positive log ratio; VIP: vasoactive intestinal peptide
