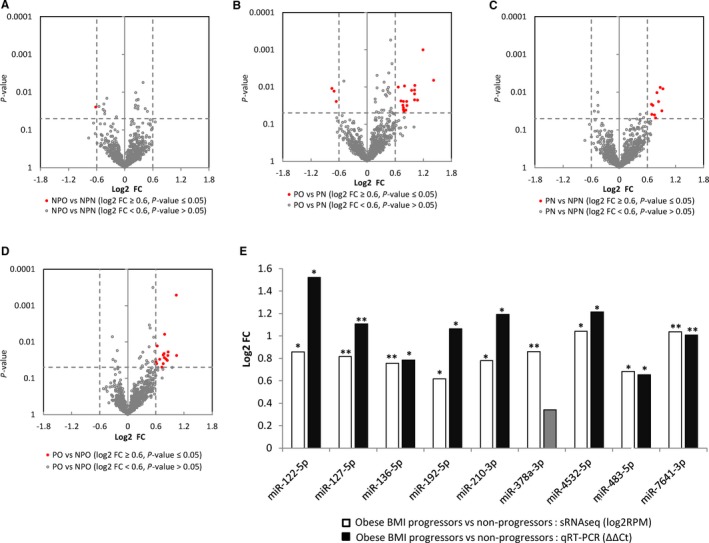
Figure 2.

Impact of BMI on miRNA spectra in progressors and non‐progressors. A, Volcano plot of log2 fold change (log2FC) vs P‐value between obese non‐progressors (NPO) and normal non‐progressors (NPN), (B) obese progressors (PO) and normal progressors (PN), (C) normal progressors (PN) and normal non‐progressors (NPN), and (D) obese progressors (PO) and obese non‐progressors (NPO). Grey unfilled circles represent miRNAs with a P > 0.05, black circles represent miRNAs with a P < 0.05, and a Log2FC between ±0.28 and ±0.58 (Fold change between 1.2 and 1.5, respectively), and red circles represent miRNAs with a P < 0.05, and a log2FC>±0.58 (fold change greater than 1.5). E, qRT‐PCR results for 9 selected miRNAs (normalized to the average of miR‐16‐5p and miR‐21‐5p) between obese BMI progressors vs obese BMI non‐progressors (PO vs NPO). Values are represented as log2FC (Y‐axis) and the miRNA identity is indicated on the X‐axis. The qRT‐PCR data (black bars) is derived from ΔΔCt values and the sRNAseq data (white bars) is derived from log2RPM values.Single asterisks indicate a P < 0.05, double asterisks indicate a P < 0.01 Grayed out values without an asterisks indicate an insignificant result
