Figure 3.

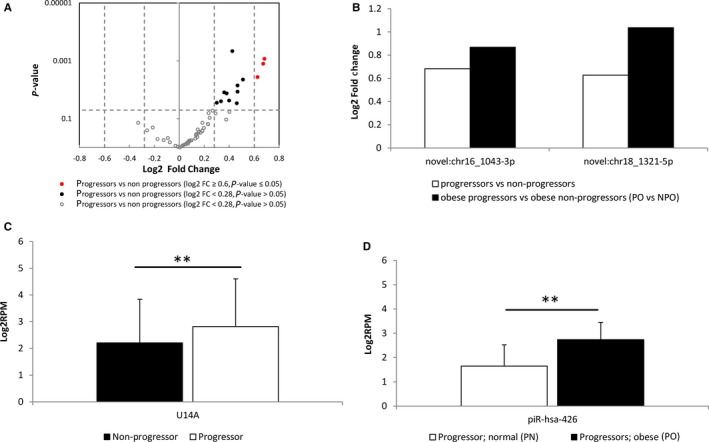
Novel miRNAs, and other small RNAs associated with T2DM progression._A, Volcano plot of log2 fold change (log2FC) vs p‐value between progressors and non‐progressors. Grey unfilled circles represent miRNAs with a P > 0.05, black circles represent miRNAs with a P < 0.05, and a Log2FC between ±0.28 and ±0.58 (Fold change between 1.2 and 1.5, respectively), and red circles represent miRNAs with a P < 0.05, and a log2FC>±0.58 (fold change greater than 1.5). B, Log2FC values for the 2 novel miRNAs showing significant concentration changes between all progressors and non‐progressors (white) and obese progressors and obese non‐progressors (grey) (see Supplemental Table S2). (C) Log2RPM values showing differences between non‐progressors (black) and progressors (white) for the snoRNA, U14A. (B) Log2RPM values showing differences between normal BMI progressors (PN, white), and obese progressors (PO, dotted) for the piRNA, piR‐426. A double asterisk indicates a P < 0.01
