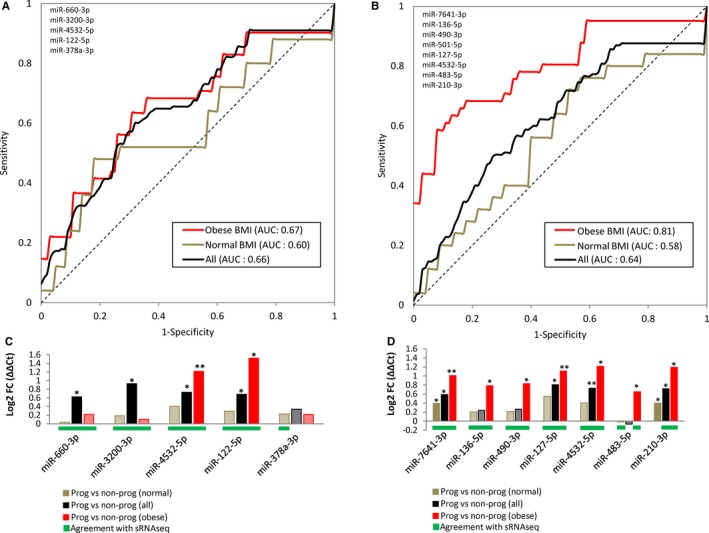
Figure 4.

ROC analysis of miRNA biomarker panels. Receiver Operating Characteristic (ROC) analysis for predictive miRNA panels for all samples between progressors and non‐progressors (A) and obese progressors and obese non‐porgressors (B). Sensitivity and specificity are plotted against each other, and the average Area Under the Curve (AUC) is given for each patient group tested. All patients = black, obese patients = red, normal BMI patients = brown. C, qRT‐PCR results for the five‐miRNA panel (normalized to the average of miR‐16‐5p and miR‐21‐5p) between all progressors and non‐progressors (black), obese BMI progressors and non‐progressors (red), and normal BMI progressors and non‐progressors (brown). D, qRT‐PCR results for the eight‐miRNA panel (normalized to the average of miR‐16‐5p and miR‐21‐5p) between all progressors and non‐progressors (black), obese BMI progressors and non‐progressors (red), and normal BMI progressors and non‐progressors (brown). Values are represented as log2FC (ΔΔCt) on the Y‐axis and the miRNA identity is indicated on the X‐axis. Single asterisks indicate a P < 0.05, double asterisks indicate a P < 0.01. Grayed out values without an asterisks indicate an insignificant result. Green bars below values indicate agreement with sRNAseq (see Table 2)
