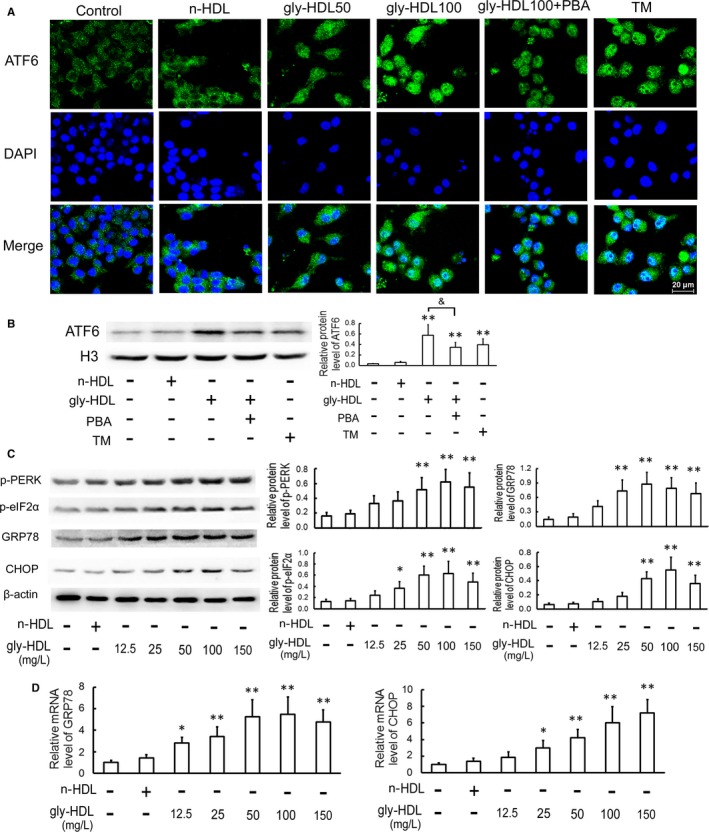
Figure 2.

Gly‐HDL activates ER stress‐CHOP pathway in RAW264.7 cells. A, Cells were pre‐incubated with or without 5 mmol/L of PBA for 1 h, and then exposed to gly‐HDL (50 or 100 mg/L) or TM (4 mg/L) for 24 h. Immunofluorescence experiments showed ATF6 labelled by Alexa Fluor 488 (green) and nuclei stained with DAPI (blue). Representative fluorescent images captured by a laser scanning confocal microscope are shown. Scale bar = 20 μm. B, Cells were pre‐treated with or without 5 mmol/L of PBA for 1 h, and then exposed to gly‐HDL (100 mg/L) or TM (4 mg/L) for 24 h. The protein level of ATF6 in nuclear extracts was analysed by Western blotting and normalized to Histone (H3) level. C and D, Cells were treated as described in Figure 1 E, and then the protein and mRNA levels of ER stress markers were analysed by Western blotting and quantitative real‐time PCR, respectively. Data are expressed as the mean ± SD of at least three independent experiments. *P < 0.05, **P < 0.01 vs control group; P < 0.05
