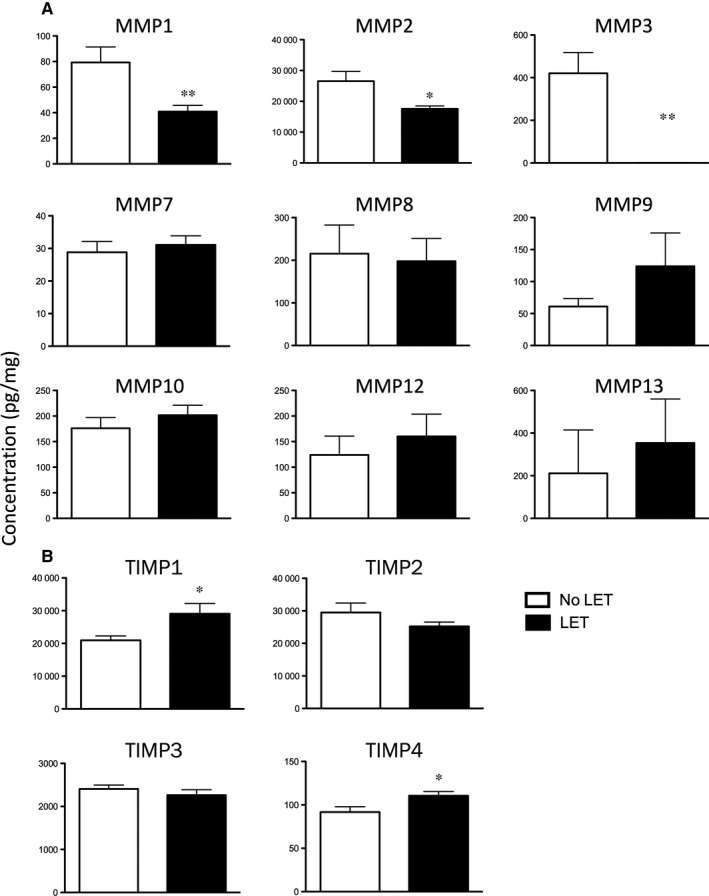
Figure 4.

Protein concentration of MMPs (A, 9‐plex Luminex panel) and TIMPs (B, 4‐plex Luminex panel) in vaginal tissues of post‐menopausal women with severe POP treated with LET (black bars) and not treated (controls, white bars). N = 19/group. Data presented as mean ± SEM. Statistical analysis was performed with independent sample t test. A significant difference is indicated by * (P < 0.05), or ** (P < 0.01)
