Figure 3.

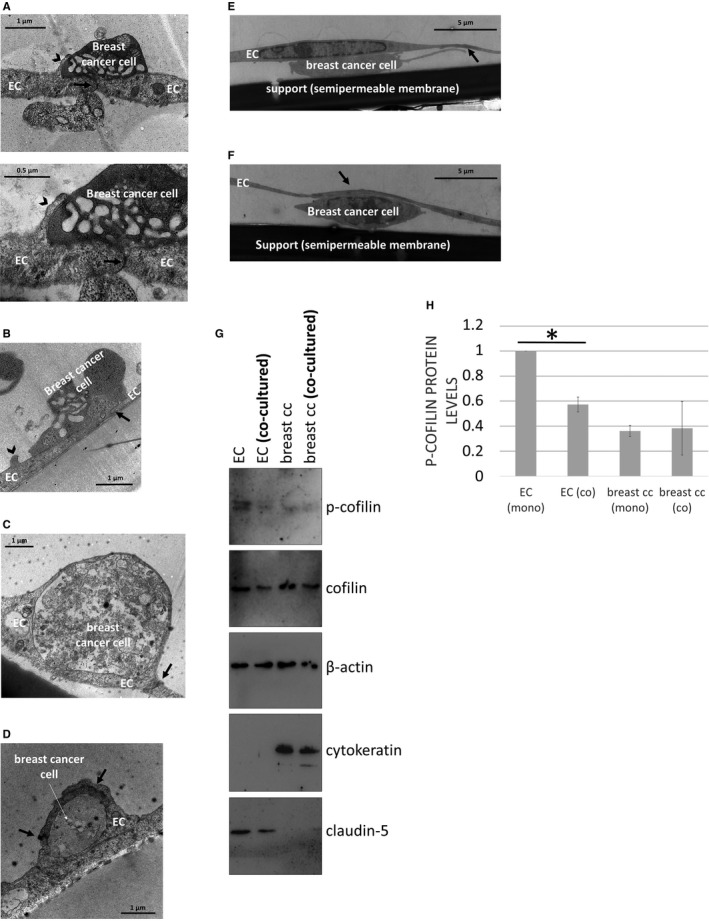
Interactions of breast cancer cells with brain endothelial cells. Breast cancer cells (A, C, E, F: MDA‐MB‐231; B, D: 4T1) were seeded on the top of confluent RBEC monolayers and left for 8 hours. Representative transmission electron micrographs show the adhesion (A, B) and incorporation (C, D) steps. (A) Bottom panel is a higher magnification of the image in the top panel. (E and F) Transmigrated breast cancer cells. Interendothelial junctions are indicated with black arrows, endothelial membrane protrusions are marked with black arrowheads. (G) EGFP‐MDA‐MB‐231 cells were co‐cultured with D3 cells. After 24 hours, the two cell types were separated by sorting. Representative Western blot images are shown. Purity of the samples is shown by the absence of epithelial‐specific cytokeratin in endothelial cells and absence of endothelial‐specific claudin‐5 in the tumour cells. (H) Quantification of p‐cofilin protein levels normalized to cofilin (average ± SD), based on the Western blot images. N = 3 independent experiments. *P < 0.01 as assessed by Student's t test (when endothelial cell—EC—mono and co‐cultures were compared)
