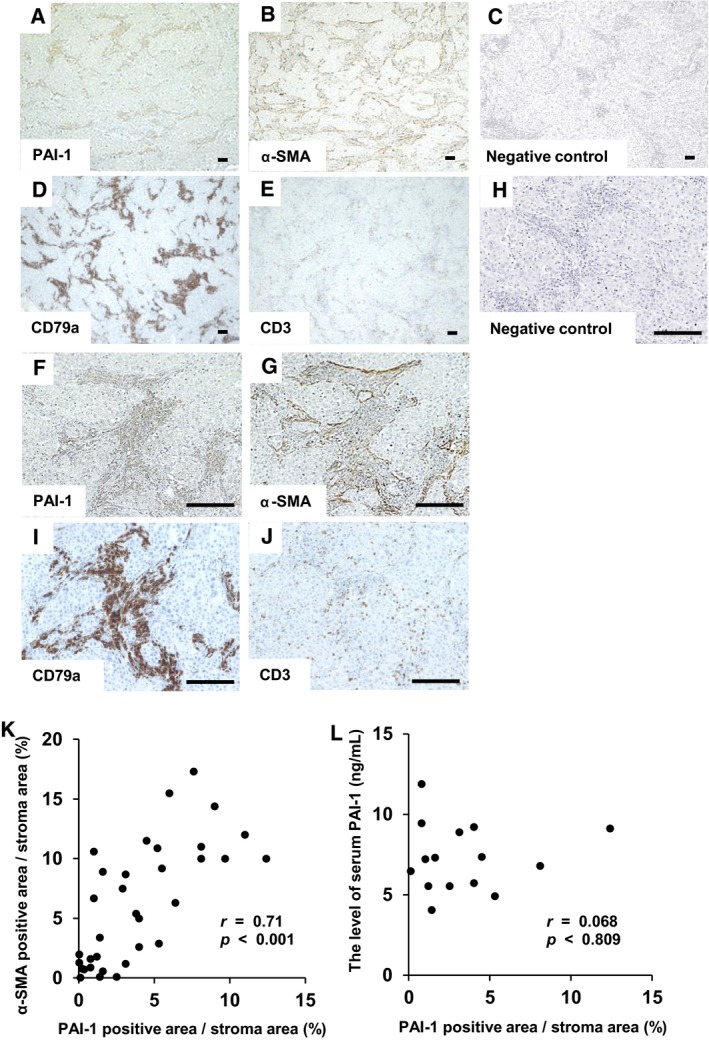
Figure 1.

Immunohistochemical analysis of lung adenocarcinoma tissue sections and correlation of plasminogen activator inhibitor‐1 (PAI‐1) and alpha‐smooth muscle actin (α‐SMA) expression. Representative immunohistochemical staining of (A) PAI‐1, (B) α‐SMA, (C) negative control for PAI‐1 and α‐SMA, (D) CD79a and (E) CD3 in lung adenocarcinoma tissue sections. (A)‐(E), magnification: ×40. (F)‐(J), magnification: ×200. Scale bar = 50 μm. The proportion of PAI‐1 or α‐SMA positive area/stroma was calculated as described in Materials and Methods. (K) The correlation between the positive area of PAI‐1 and α‐SMA in the tumour stroma (r = 0.71, P < 0.001). (L) The correlation between the positive area of PAI‐1 in the stroma and the concentration of PAI‐1 in the serum (r = 0.068, P = 0.810). The data were analysed with the Pearson's correlation coefficient test
