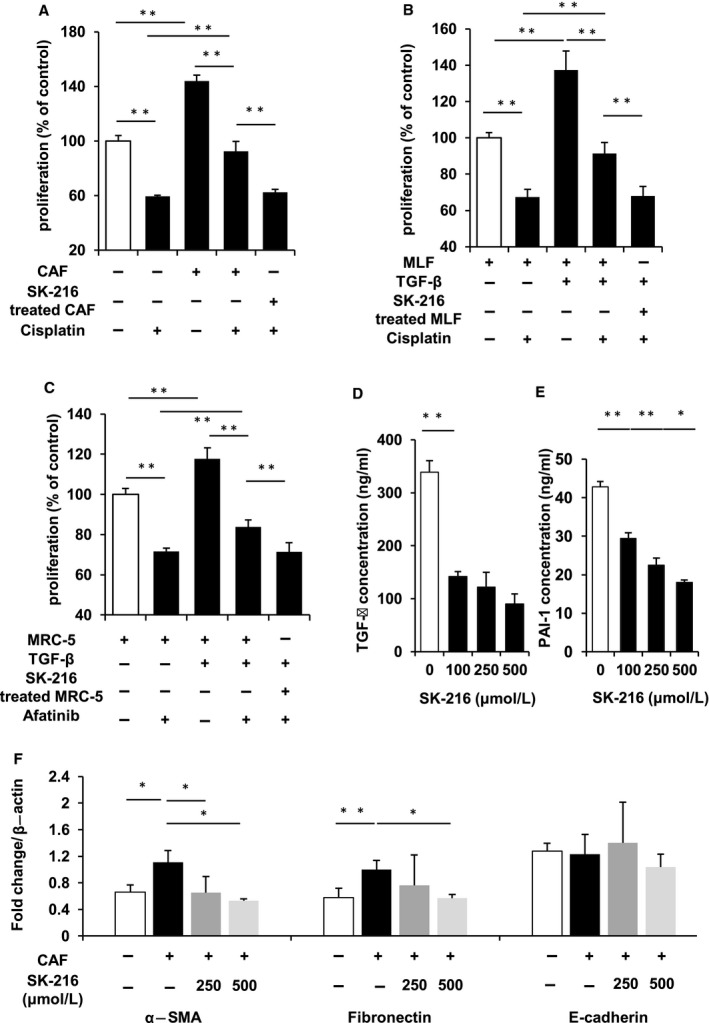
Figure 4.

Inhibition of plasminogen activator inhibitor‐1 (PAI‐1) increased the effect of chemotherapy on lung cancer cells co‐cultured with fibroblasts through suppressing the MF characteristics of fibroblasts. (A) Cancer‐associated fibroblasts (CAFs) were cultured with or without SK‐216 (500 μmol/L) in the insert well on 24‐well plates for 36 hours. The insert well with CAFs was transferred into a new 24‐well plate. A549 cells were seeded at a density of 4 × 10⁴ cells/well in the 24‐well plate. After 12 hours, cisplatin (10 μmol/L) was added to the medium. Thereafter, the proliferation of cancer cells was determined after 36 hours. (B) MRC‐5 (C) MLF were pre‐incubated with or without SK‐216 (50 μmol/L) in the medium for 1 hour followed by stimulation with TGF‐β1 in the insert well on 24‐well plates. After incubation for 36 hours, the insert well with the MRC‐5 or MLF was transferred into a new 24‐well plate. Thereafter, (B) PC‐9 or (C) LLC cells were seeded at a density of 4 × 10⁴ cells/well in the 24‐well plate. After 12 hours, (B) cisplatin (10 μmol/L) (C) afatinib (1 μmol/L) were added to the medium. Thereafter, the proliferation of cancer cells was determined after 36 hours. (D), (E) CAFs were cultured with or without SK‐216 (100, 250, or 500 μmol/L) in the medium. ELISA assay of PAI‐1 and TGF‐β level secreted by CAFs in the medium. (F) A549 were co‐cultured with CAFs with or without SK‐216 (100, 250, or 500 μmol/L) in the medium for 36 hours. The cells were harvested, and total RNA was extracted. The expression of α‐SMA and fibronectin as mesenchymal marker, e‐cadherin as epithelial marker was examined by quantitative RT‐PCR. The data represent the mean values of four or six samples (±SD) and were analysed with the student t test. *P < 0.05; **P < 0.01
