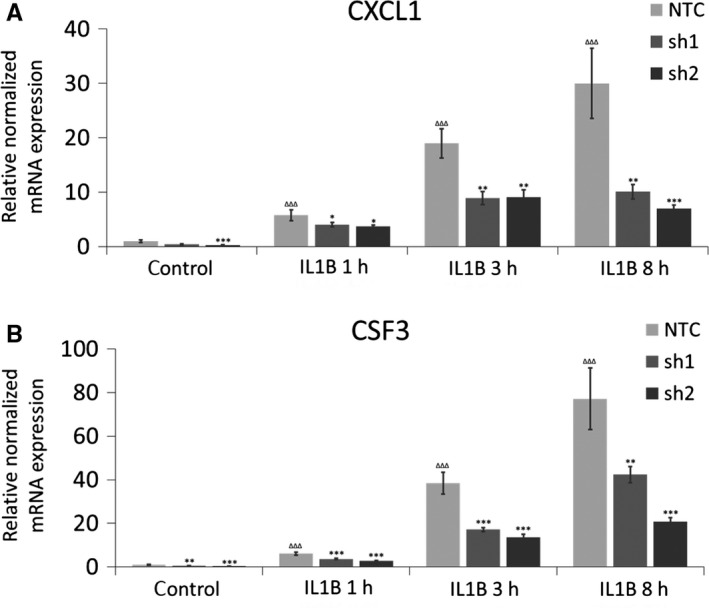
Figure 2.

Control of CXCL1 and CSF3 transcript levels by MAFF in PHM1‐31 myometrial cells. PHM1‐31cells were transduced with shRNA (NTC, sh1 or sh2) and treated (or not) with 10 ng/mL IL1B for 1, 3 or 8 h. The regulation of CXCL1 (A) and CSF3 (B) mRNA expression upon MAFF knockdown was quantified by quantitative PCR. Data represent mean values ± SEM; unpaired t‐test; *P < 0.05; **P < 0.01; ***P < 0.001, ΔΔΔ P < 0.001. Asterisks correspond to the significance with the control (NTC) at the same time point and triangles to the significance between controls
