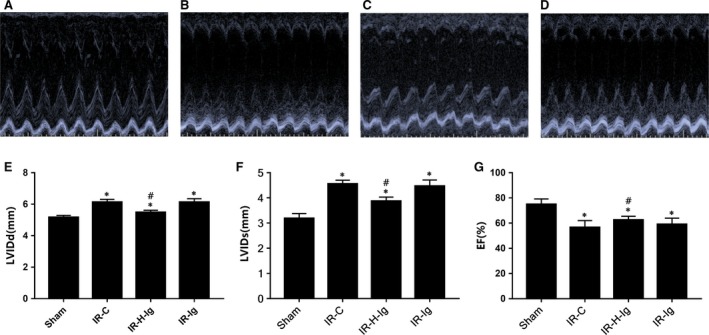
Figure 4.

Doppler echocardiography. (A‐D) The M‐mode echocardiograms of the short‐axis midventricular view of different groups. (E‐G), The changes of left ventricular internal dimension in diastole (LVIDd), left ventricular internal dimension in systole (LVIDs) and left ventricular ejection fraction (LVEF) of different groups (n = 6 for each group). Anti‐HMGB1 treatment might improve heart function. *P < 0.05, comparisons of IR‐C, IR‐H‐Ig and IR‐Ig groups with Sham group; #P < 0.05, comparisons of IR‐H‐Ig and IR‐Ig group with IR‐C group
