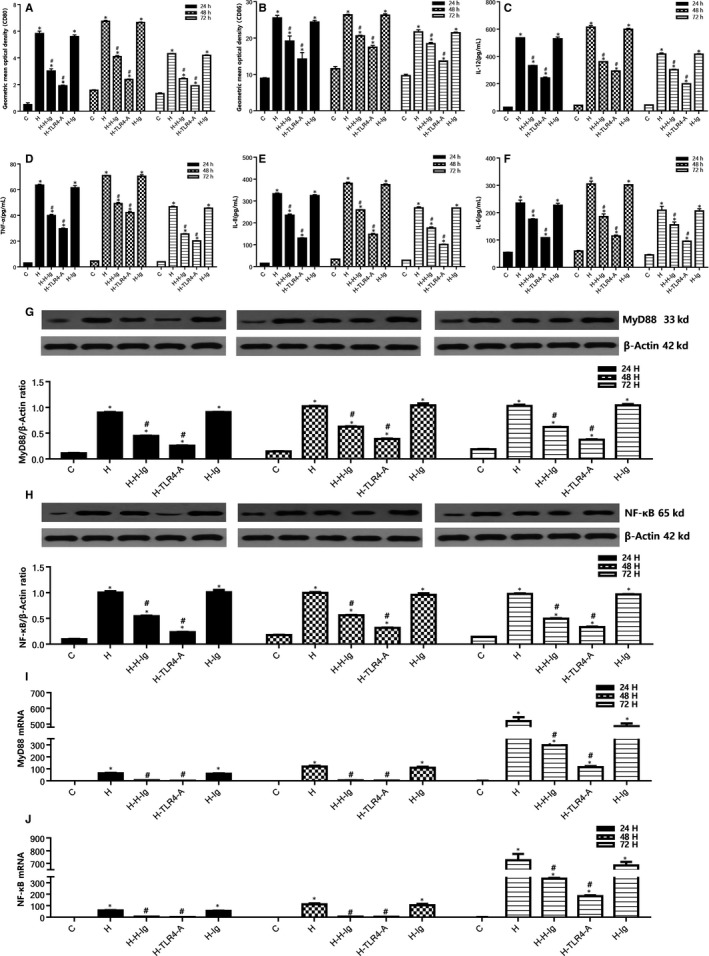
Figure 5.

Regulation of HMGB1‐TLR4 signalling pathway on DCsHMGB1 activates DCs. Comparison of expression of CD80 and CD86 in mDCs among all groups. After isolation, culture, purification and identification of DCs, the expression of mDCs costimulatory molecules was detected by flow cytometry. A, The geometric mean optical density of CD80 in DCs; (B) the geometric mean optical density of CD86 in DCs. Comparison of 24, 48, 72 h concentrations of IL‐12, TNF‐α, IL‐8, IL‐6, in the supernatant among all groups. C, the changes of concentration of IL‐12 in the supernatant at 24, 48 and 72 h in each group; (D) the changes of concentration of TNF‐α in the supernatant at 24, 48 and 72 h in each group; (E) the changes of concentration of IL‐8 in the supernatant at 24, 48 and 72 h in each group; (F) the changes of concentration of IL‐6 in the supernatant at 24, 48 and 72 h in each group. Comparison of 24, 48, and 72 h protein and mRNA levels of MyD88, NF‐κB of mDCs from different groups. G, 24, 48, and 72 h Western blot analysis of MyD88 protein expression; (H) 24, 48, and 72 h Western blot analysis of NF‐κB protein expression; (I) 24, 48, and 72 h relative expression of MyD88 mRNA; (J) 24, 48, and 72 h relative expression of NF‐κB mRNA. *P < 0.05, comparisons of H, H‐H‐Ig, H‐TLR4‐A and H‐Ig groups with C group; #P < 0.05, comparisons of H‐H‐Ig, H‐TLR4‐A and H‐Ig group with H group
