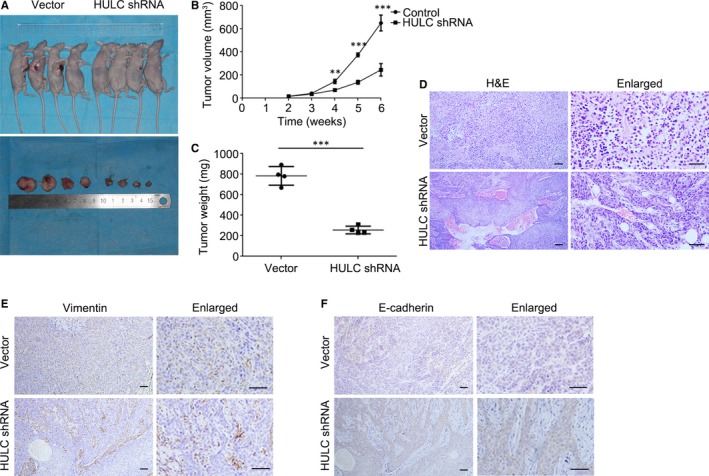
Figure 7.

HULC down‐regulation inhibits tumorigenesis. A, Pictures of nude mice bearing xenograft tumors generated using SCC15 stable cells and of surgically removed tumors. B, Tumor growth curve showing change in tumor volume against weeks after injection. Data are presented as means ± SEM of 3 independent experiments. Student's t test, **P < 0.01, ***P < 0.001. C, Tumor weight plots of vector‐control and HULC‐depleted groups. Student's t test, ***P < 0.001. D, Representative H&E staining and enlarged images from vector‐control and HULC‐depleted tumor groups. E, Images of IHC staining performed for detecting the expression of vimentin and E‐cadherin in vector‐control and HULC‐depleted tumor groups; scale bar = 50 μm
