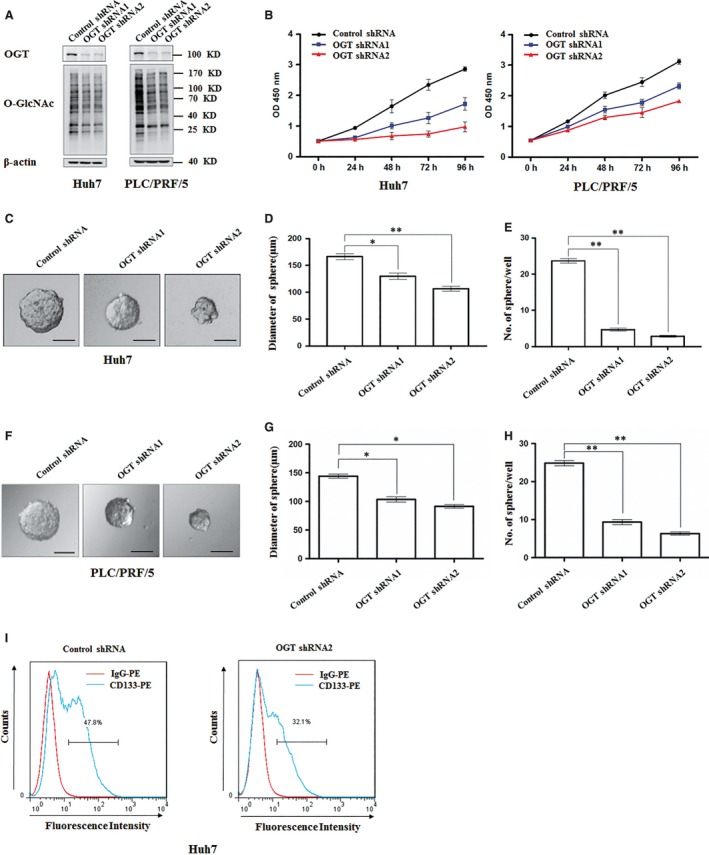
Figure 2.

Knockdown of OGT inhibits the proliferation and tumorsphere formation of hepatoma cell in vitro. A, Huh7 and PLC/PRF/5 cells were infected with control shRNA, OGT shRNA1, and OGT shRNA2 lentivirus. Protein lysates were collected after 48 h for immunoblot analysis with indicated antibodies. β‐actin expression was served as a loading control. B, Cell proliferation of Huh7 and PLC/PRF/5 cells infected with control shRNA, OGT shRNA1, and OGT shRNA2 lentivirus were measured with CCK8 assay. (C‐H) Huh7 and PLC/PRF/5 cells, respectively, infected with the indicated lentivirus were seeded into 96‐well plates. After 12 d, tumorsphere were counted and quantified. Representative images of sphere (scale bars, 100 μm) were shown (C, F). The diameter of sphere (D, G) and number of sphere (E, H) were count. Data represent mean ± SD of at least three independent experiments. *P < 0.05; **P < 0.01. I, Huh7 cells expressing either control shRNA or OGT shRNA2 were incubated with PE‐labelled anti‐AC133 antibody. The percentages of CD133+ cells in graphs were analysed by flow cytometry. Red line, control IgG staining; blue line, CD133 staining. Representative flow cytometry data from three independent experiments were shown
