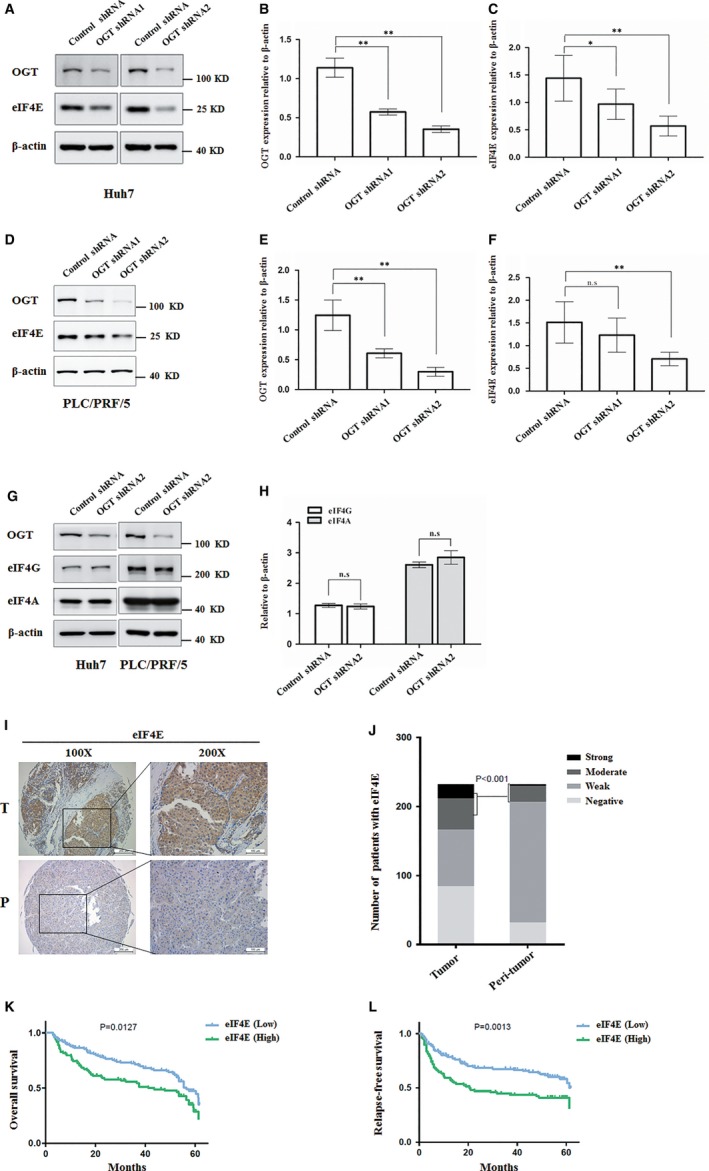
Figure 5.

OGT knockdown reduces eIF4E protein expression and higher expression of eIF4E indicates a poor prognosis in HCC patients. A, The protein level of eIF4E was analysed by western blotting in Huh7 infected with control shRNA, OGT shRNA1 and OGT shRNA2 lentivirus. β‐actin expression was served as a loading control. B, OGT values were calculated from images in A. Data represent mean ± SD of at least three independent experiments. **P < 0.01. C, eIF4E values were calculated from images in A. Data represent mean ± SD of at least three independent experiments. *P < 0.05; **P < 0.01. D, The protein level of eIF4E was analysed by western blotting in PLC/PRF/5 cells infected with control shRNA, OGT shRNA1, and OGT shRNA2 lentivirus. β‐actin expression was served as a loading control. E, OGT values were calculated from images in D. Data represent mean ± SD of at least three independent experiments. **P < 0.01. F, eIF4E values were calculated from images in D. Data represent mean ± SD of at least three independent experiments. **P < 0.01; n.s, no significance. G, The protein level of eIF4A and eIF4G were analysed by western blotting in Huh7 and PLC/PRF/5 cells infected with control shRNA or OGT shRNA2 lentivirus. β‐actin expression was served as a loading control. H, eIF4G, and eIF4A values were calculated from images in G. Data represent mean ± SD of at least three independent experiments. n.s, no significance. I, Representative immunohistochemical staining of eIF4E in liver cancer tissues and peri‐tumour liver tissues. J, Quantitative analysis of liver cancer tissue microarrays showed that the expression of eIF4E was higher in liver cancer tissues than in normal liver tissues (P < 0.001). K, Kaplan‐Meier overall survival (OS) curve of HCC patients in correlation with expression of eIF4E. L, Kaplan‐Meier disease‐free survival (DFS) curve of HCC patients in correlation with expression of eIF4E. The DFS and OS rate significantly decreased in high expression of eIF4E (green line) compared to low expression of eIF4E (blue line)
