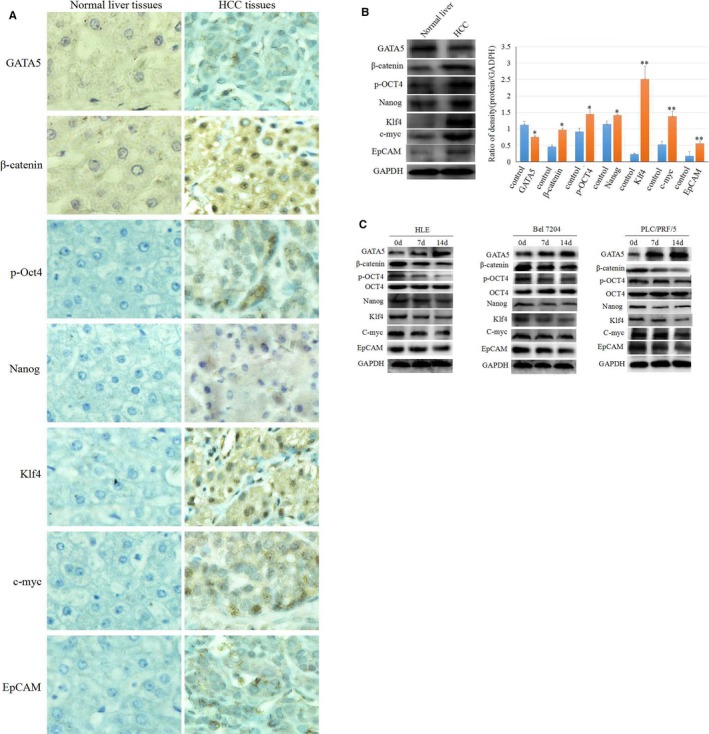
Figure 1.

The expression of GATA5, β‐catenin and reprogramming genes in human HCC tissues and cells. A, Immunohistochemistry analysis of the expression of β‐catenin and reprogramming genes p‐Oct4, Nanog, Klf4, c‐myc and EpCAM in HCC tissues and normal human liver tissues. Brown staining represents positive expression. B, Western blot analysis of the expression of β‐catenin and reprogramming genes p‐Oct4, Nanog, Klf4, c‐myc and EpCAM in HCC tissues and normal human liver tissues, the right image indicated the expression difference of proteins, *P < 0.05, **P < 0.01 vs control groups, N = 3. C, HLE, Bel 7402 and PLC/PRF/5 cell were transfected with CDH‐GATA5 for 0, 7 and 14 d, and Western blot analysis was performed for the expression of β‐catenin and reprogramming genes p‐Oct4, Nanog, Klf4, c‐myc and EpCAM. Images are representative of three independent experiments
