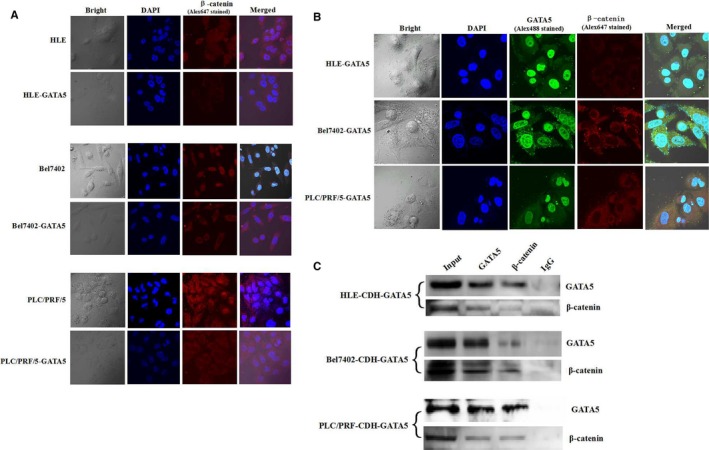
Figure 6.

Localization of β‐catenin and co‐localization of GATA5 and β‐catenin in HCC cells. A, HLE, Bel 7402 and PLC/PRF/5 cells were transfected with pcDNA3.1‐GATA5 or no transfect (control cells), followed by culturing at 37°C in a humidified atmosphere of 5% CO2. Localization of β‐catenin was visualized, and images were captured under laser confocal microscopy. Nuclei are stained with DAPI (blue). β‐Catenin is labelled with FRITC (red). B, HCC cell lines transfected with pcDNA3.1‐GATA5 were cultured at 37°C in a humidified atmosphere of 5% CO2. Localization of GATA5 and β‐catenin was visualized. Images were captured under laser confocal microscopy. Nuclei are stained with DAPI (blue). GATA5 and β‐catenin are labelled with Alex488 (green) and Alex647 (red) respectively. C, Co‐IP was applied to analyse GATA5 interact with β‐catenin in HCC cells. Three independent experiments were performed for these data
