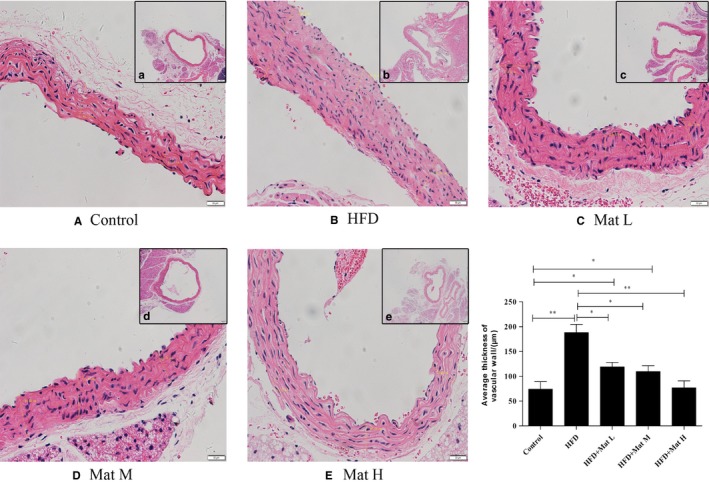
Figure 2.

Representative photomicrographs of vascular walls were stained with haematoxylin‐eosin for histological evaluation. A, Control group. B, High‐fat diet group. C‐E, High‐fat diet combined with matrine from low to high dosages, n = 10 each group (Original magnification: a‐e, 40× objective, scale bar: 200 μm, A‐E, 200× objective, scale bar: 50 μm)
