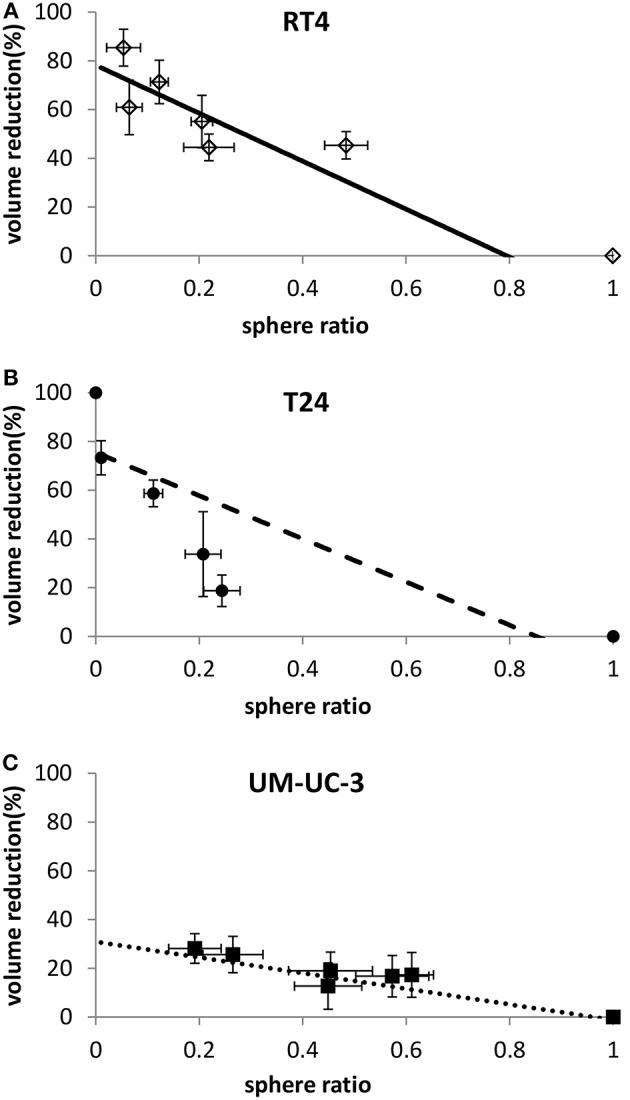
Figure 7.

Linear correlation between sphere volume reduction and sphere ratio for each cell line. Each data point represents the mean value of at least three independent experiments ±SEM. (A) RT4 cell line (R2 = 0.9). (B) T24 cell line (R2 = 0.64). (C) UM-UC-3 cell line (R2 = 0.9). Data are fitted to a linear model. Fitting parameters and the corresponding R2 values are shown in Supplementary Table 8.
