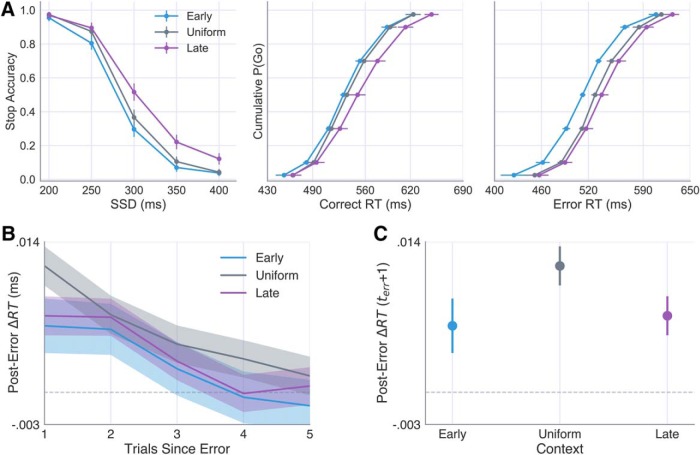
Figure 3.
Effects of context on stop accuracy and RTs. A, Subject-averaged stop accuracy (left) and cumulative RT distributions for correct (Go trials; middle) and error (Stop trials; right) responses in the Early (blue), Uniform (gray), and Late (purple) contexts. B, Posterror slowing following failed Stop trials in each context and subsequent decay over five trials. C, The posterror slowing observed immediately after a failed stop (terr + 1) in each context (e.g., first data point in B). Error bars and shaded area represent the 95% CI calculated across subjects.

