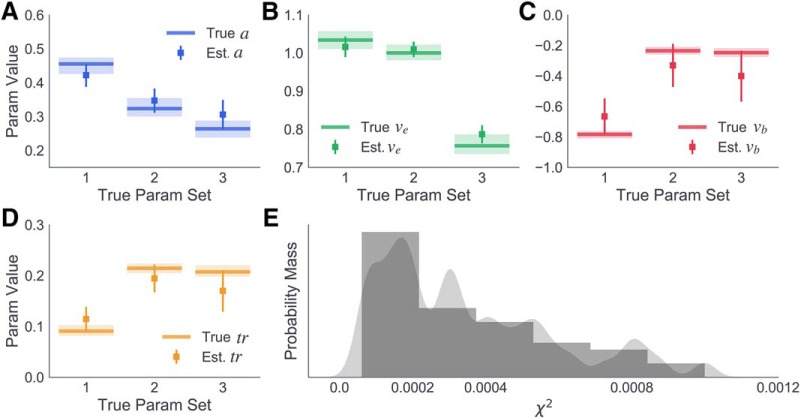
Figure 4.
Simulation and parameter recovery analysis of DPM. A, True and estimated boundary height (a; blue), (B) braking drift rate (vb; red), (C) onset time (tr; purple), and (D) execution drift rate (ve; green) for three generative parameter sets. Lines indicate true generative parameter means. Lighter colors represent the range of sampled subject-level estimates. Squares represent estimated parameter means. Error bars represent ±1 SD. E, Distribution of χ2 values for fits to all 60 simulated datasets (gray).

