Figure 5.
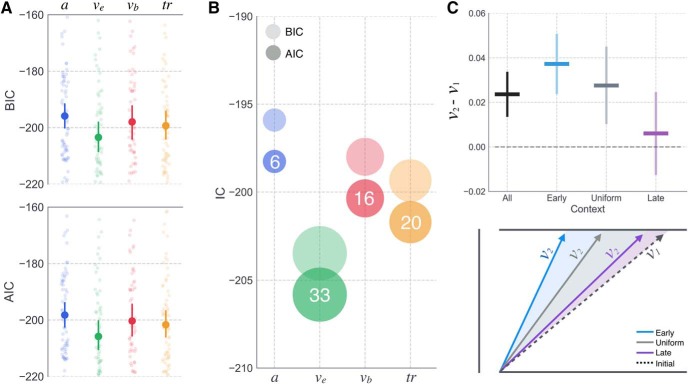
Single-subject DPM fits and model comparison. Variants of the DPM were fit to all individual subject datasets with different parameters left free to vary between the first and second half of trials. A, Mean subject BIC and AIC scores for boundary height (a; blue), execution drift rate (ve; green), braking drift rate (vb; red), and onset delay (tr; yellow) (dark circles). Lighter circles represent an individual subject. Error bars represent 95% CI. B, Same mean values as in A, but with size of the dots scaled to reflect the number of subjects for which each model had the lowest AIC/BIC score. White text indicates the number of subjects best described by each model (e.g., factor used to scale the size of the dots). C, Observed increase in ve values estimated for the first (v1) and second half (v2) of trials in each context. Error bars represent 95% CI. Schematic represents the relative increase in ve in Early (cyan), Uniform (gray), and Late (purple) contexts, compared with a shared initial drift rate (i.e., before learning; black dotted line).

