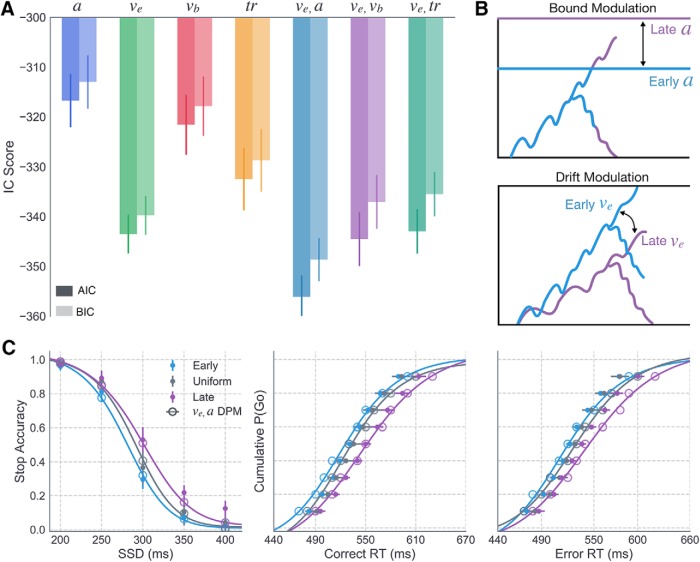
Figure 6.
Group-level model comparison and best fit predictions across context. A, AIC (dark) and BIC (light) scores for all single-parameter models, allowing execution boundary height (a; blue), execution drift rate (ve; green), braking drift rate (vb; red), or onset delay (tr; yellow) to vary across contexts. Three dual-parameter models were also included to test for possible benefits of allowing ve (best fitting single parameter model) to vary along with a (teal), vb (purple), or tr (dark green). Error bars indicate the 95% CI. B, Qualitative effects of context on a (top) and ve parameter estimates (bottom) in the Early and Late contexts. C, Model predicted data (lines and larger transparent circles) simulated with best fit parameters from the ve, a model, corresponding to dotted circle in A overlaid on the average empirical data for Early (cyan), Uniform (gray), and Late (purple) contexts. Error bars represent 95% CI.

