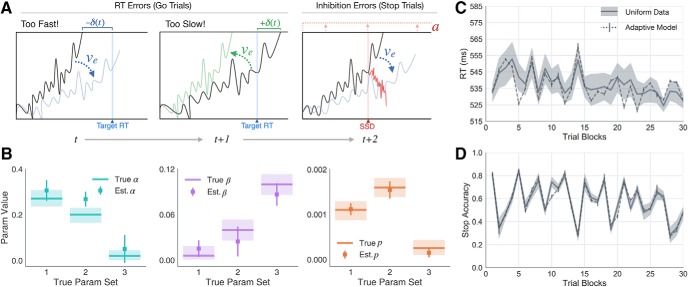
Figure 7.
Adaptive DPM parameter recovery and learning predictions in Uniform context. A, Schematic showing how the execution drift rate is modulated following timing errors on Go trials (left) and how the boundary height is modulated following failed inhibitions on Stop trials. B, Parameter recovery results for α (left, teal), β (middle, purple), and p (right, orange) parameters in the primary version of the adaptive DPM. Horizontal lines indicate true generative parameter means. Light colors represent the range of sampled subject-level estimates. Squares represent estimated parameter means. Error bars represent ±1 SD. Subject-averaged timeseries (dark line) and 95% CI (gray area) showing the (C) RT on Go trials and (D) accuracy on Stop trials. Each point in the timeseries (n = 30) represents the windowed average RT/accuracy over ∼30 trials. The corresponding adaptive model predictions are overlaid (dotted line), averaged over simulations to each individual subject's data.

