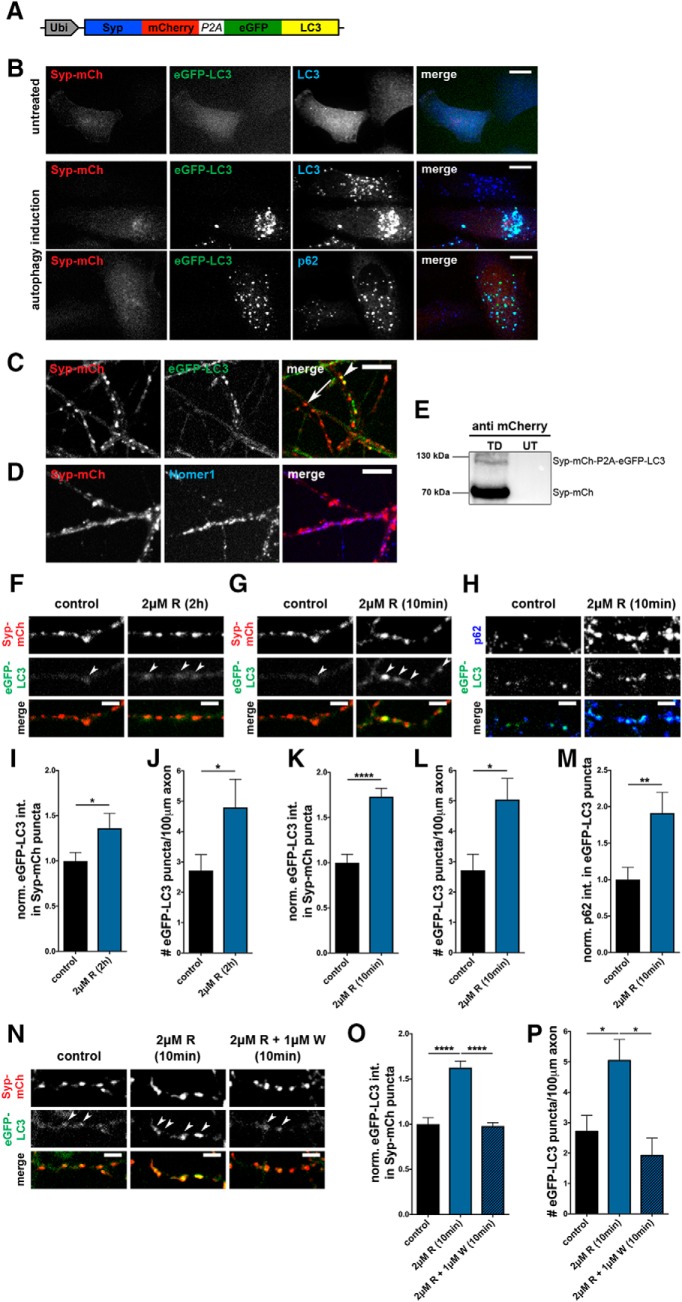
Figure 1.
Rapamycin induces rapid increase in presynaptic autophagy. A, Schematic of lentiviral vector FU-Syp-mCherry-P2A-eGFP-LC3 expressing Syp-mCherry (mCh) and eGFP-LC3 under a ubiquitin promoter. Post-translational cleavage at the P2A site separates the two proteins. B, Autophagy induction (EBSS + 100 μm chloroquine for 2 h) of FU-Syp-mCherry-P2A-eGFP-LC3-expressing HeLa cells, demonstrating that, following autophagy induction, eGFP-LC3 puncta colocalize with both endogenous LC3 and p62, but not Syp-mCh. C, Live cell images of hippocampal neurons expressing FU-Syp-mCherry-P2A-eGFP-LC3 analyzed at 14 DIV. Syp-mCh and eGFP-LC3 exhibit different patterns, indicating P2A-mediated cleavage. Arrow indicates Syp-mCh puncta. Arrowhead indicates colocalization of Syp-mCh and eGFP-LC3. D, Representative images of hippocampal neurons infected with FU-Syp-mCherry-P2A-eGFP-LC3 and immunostained with antibodies against the postsynaptic protein Homer1. Colocalization of Syp-mCh and Homer1 indicates presynaptic targeting of Syp-mCh. E, Western blot of lysates prepared from hippocampal neurons infected with FU-Syp-mCherry-P2A-eGFP-LC3 (TD) or UT and stained with mCherry antibodies. Top band, Uncleaved Syp-mCh-P2A-eGFP-LC3 fusion protein. Bottom band, Cleaved Syp-mCh. The lower size band representing cleaved Syp-mCh is much more abundant than the higher molecular size band, representing Syp-mCh-P2A-eGFP-LC3 fusion protein, thus indicating efficient cleavage. F–H, Images of hippocampal neurons expressing FU-Syp-mCherry-P2A-eGFP-LC3, treated with 2 μm rapamycin (R) for 2 h (F) or 10 min (G, H) before fixation and staining with antibodies against p62 (H). I–M, Quantification of the normalized intensity of eGFP-LC3 levels at Syp-mCh puncta (I, K) as well as the number of puncta/100 μm of axon (J,L) after 2 h (I, J) or 10 min (K, L) of 2 μm rapamycin treatment. I, Control = 1 ± 0.094, n = 412 synapses, 3 independent experiments; 2 μm R (2 h) = 1.36 ± 0.164, n = 301 synapses, 3 independent experiments, p = 0.0414. J, Control = 2.72 ± 0.529, n = 40 axons, 4 independent experiments; 2 μm R (2 h) = 4.80 ± 0.928, n = 20 axons, 2 independent experiments, p = 0.0407. K, Control = 1 ± 0.094, n = 412 synapses, 3 independent experiments; 2 μm R (10 min) = 1.73 ± 0.092, n = 343 synapses, 3 independent experiments; p < 0.0001. L, Control = 2.72 ± 0.529, n = 40 axons, 4 independent experiments; 2 μm R (10 min) = 5.05 ± 0.695, n = 47 axons, 4 independent experiments; p = 0.0111. Quantification of the normalized p62 levels at eGFP-LC3 puncta (M). M, Control = 1 ± 0.170, n = 50 puncta, 3 independent experiments; 2 μm R (10 min) = 1.91 ± 0.283, n = 52 puncta, 3 independent experiments (p = 0.0072), confirming that eGFP-LC3 puncta depict autophagic organelles. N, Images of hippocampal neurons expressing FU-Syp-mCherry-P2A-eGFP-LC3 and treated with 1 μm wortmannin (W) before and during a 10 min incubation with 2 μm rapamycin (R). O, P, Quantification of N showing that wortmannin suppresses the induction of autophagy at Syp-mCh puncta (O) and along axons (P) following the addition of rapamycin. O, Control = 1 ± 0.073, n = 540 synapses, 4 independent experiments; 2 μm R (10 min) = 1.63 ± 0.071, n = 469 synapses, 4 independent experiments; 2 μm R + 1 μm W (10 min) = 0.98 ± 0.036, n = 152 synapses, 2 independent experiments, p < 0.0001 and p < 0.0001. P, Control = 2.72 ± 0.529, n = 40 axons, 4 independent experiments; 2 μm R (10 min) = 5.05 ± 0.695, n = 47 axons, 4 independent experiments; 2 μm R + 1 μm W (10 min) = 1.92 ± 0.573, n = 20 axons, 2 independent experiments, p = 0.0187 and p = 0.01. Scale bars: B–D, 10 μm; F–H, N, 5 μm. Error bars indicate SEM. Unpaired t test (I–M) and ANOVA Tukey's multiple-comparisons test (O, P) were used to evaluate statistical significance. *p < 0.05, **p < 0.01, ****p < 0.0001.

