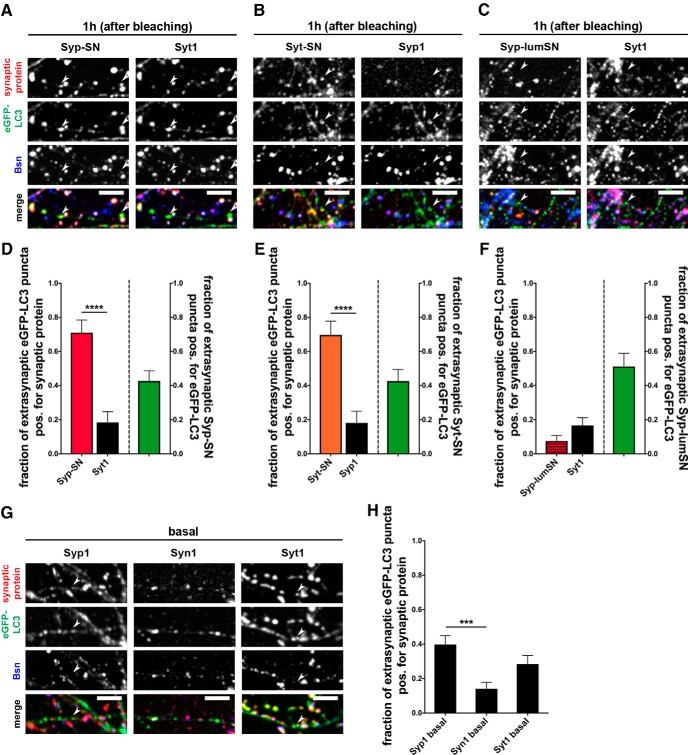
Figure 10.
ROS-damaged SV proteins selectively accumulate in autophagy organelles. A–C, Images of hippocampal neurons expressing SN-tagged synaptic proteins Syp-SN (A), Syt-SN (B), or Syp-lumSN (C) that were fixed 1 h after bleaching and stained with antibodies against GFP, SN, Bassoon, and Syt1 (A,C) or Syp1 (B). D, Quantification of the fraction of extrasynaptic eGFP-LC3 puncta positive for SN-tagged Syp, indicated by arrowheads in A, or endogenous Syt1 within the same experiment (Syp-SN = 0.71 ± 0.075, n = 38 puncta, 3 independent experiments; Syt1 = 0.18 ± 0.064, n = 38 puncta, 3 independent experiments, p < 0.0001). Also quantified is the fraction of extrasynaptic Syp-SN puncta that are positive for eGFP-LC3 (0.43 ± 0.060, n = 68 puncta, 3 independent experiments). E, Quantification of the fraction of extrasynaptic eGFP-LC3 puncta positive for SN-tagged Syt, indicated by arrowheads (B), or endogenous Syp1 within the same experiment (Syt-SN = 0.70 ± 0.081, n = 33 puncta, 2 independent experiments; Syp1 = 0.18 ± 0.068, n = 33 puncta, 2 independent experiments, p < 0.0001). Also quantified is the fraction of extrasynaptic Syt-SN puncta that are positive for eGFP-LC3 (0.43 ± 0.068, n = 54 puncta, 2 independent experiments). F, Quantification of the fraction of extrasynaptic eGFP-LC3 puncta positive for luminal SN-tagged Syp (Syp-lumSN), indicated by arrowheads in C, or endogenous Syt1 within the same experiment (Syp-lumSN = 0.08 ± 0.033, n = 66 puncta, 3 independent experiments; Syt1 = 0.17 ± 0.046, n = 66 puncta, 3 independent experiments). Also quantified is the fraction of extrasynaptic Syp-lumSN puncta that are positive for eGFP-LC3 (0.51 ± 0.077, n = 43 puncta, 3 independent experiments). G, Images of hippocampal neurons expressing FU-eGFP-LC3 fixed and stained with antibodies against GFP, Bassoon, and Syp1, Syn1, or Syt1. H, Quantification of the fraction of extrasynaptic eGFP-LC3 puncta also positive for endogenous Syp1, Syn1, or Syt1. The fraction of extrasynaptic eGFP-LC3 puncta positive for Syp1 is significantly higher than the fraction positive for Syn1 (Syp1 basal = 0.40 ± 0.051, n = 93 puncta, 2 independent experiments; Syn1 basal = 0.14 ± 0.038, n = 85 puncta, 2 independent experiments; Syt1 basal = 0.28 ± 0.050, n = 81 puncta, 2 independent experiments). Scale bars, 10 μm. Error bars indicate SEM. Unpaired t test (D–F) and ANOVA Tukey's multiple-comparisons test (H) were used to evaluate statistical significance. ***p < 0.001, ****p < 0.0001.

