
Figure 11.
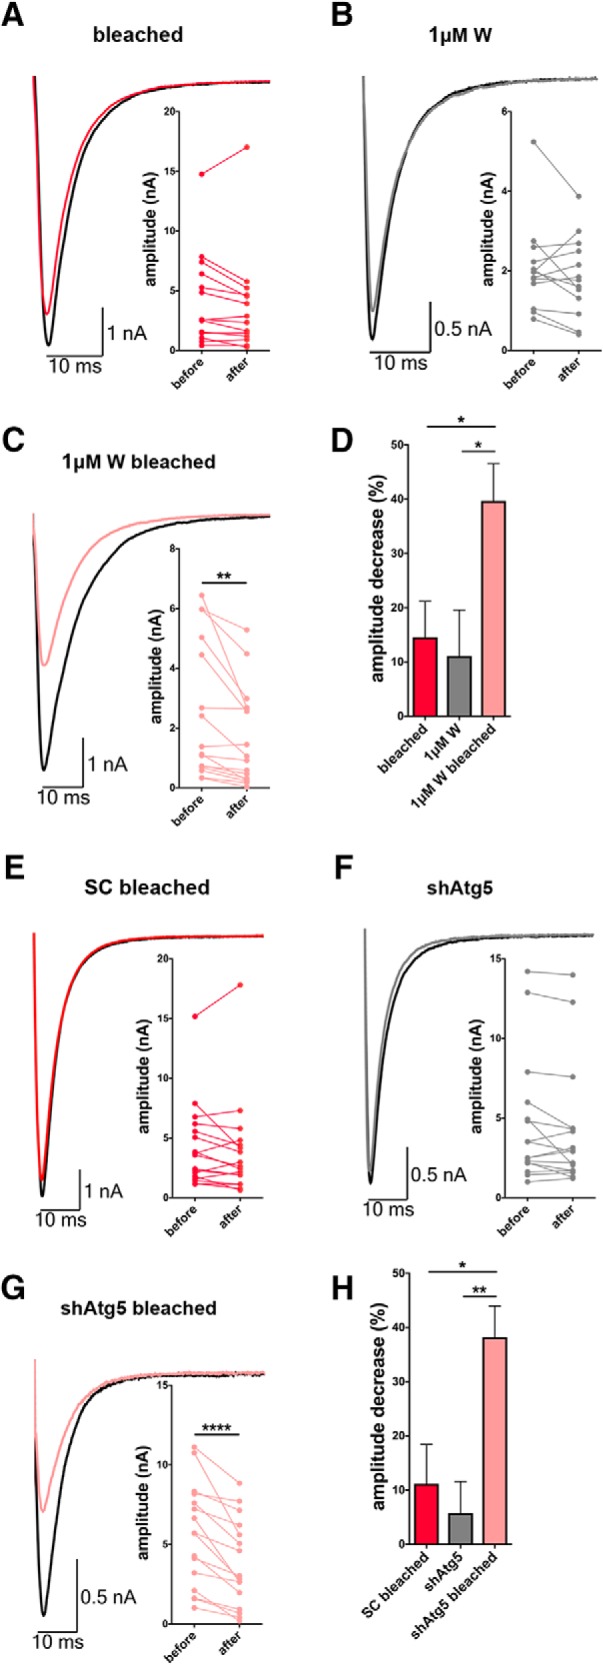
ROS-induced damage to Syp-SN impairs evoked release only when autophagy is inhibited. A–C, Example traces of whole-cell patch recordings of evoked EPSCs from autaptic hippocampal neurons expressing FU-Syp-SN-P2A-eGFP-LC3 before and 5 min after ROS-induced damage to Syp-SN either in the absence (A) or the presence of 1 μm wortmannin (W) (C). Neurons treated with wortmannin but were not bleached served as a control (B). A, Amplitude: before = 4.25 ± 1.050, after = 3.74 ± 1.134, 14 neurons, 3 independent experiments. B, Amplitude: before = 2.07 ± 0.311, after = 1.85 ± 0.277, 13 neurons, 3 independent experiments. C, Amplitude: before = 2.50 ± 0.570, after = 1.63 ± 0.409, 16 neurons, 3 independent experiments, p = 0.0042. D, Quantification of the percentage decrease in EPSC amplitude after photobleaching (A, C) or waiting period (B). The decrease in amplitude is significantly higher when 1 μm wortmannin is present (bleached = 14.57 ± 6.620, n = 14 neurons, 3 independent experiments; 1 μm W = 11.09 ± 8.479, n = 13 neurons, 3 independent experiments; 1 μm W bleached = 39.69 ± 6.869, n = 16 neurons, 3 independent experiments, p = 0.0445 and p = 0.0223). E–G, Example traces of whole-cell patch recordings of evoked EPSCs from autaptic hippocampal neurons expressing F-U6-scRNA(SC)-U-Syp-SN-P2A-eGFP-LC3 (E) or F-U6-shAtg5-U-Syp-SN-P2A-eGFP-LC3 (G) before and 5 min after ROS-induced damage to Syp-SN. Neurons expressing F-U6-shAtg5-U-Syp-SN-P2A-eGFP-LC3 that were not bleached served as a control (F). E, Amplitude: before = 4.23 ± 0.853, after = 3.87 ± 0.980, 17 neurons, 3 independent experiments. F, Amplitude: before = 4.60 ± 0.987, after = 4.22 ± 0.962, 16 neurons, 3 independent experiments. G, Amplitude: before = 5.58 ± 0.800, after = 3.79 ± 0.687, 16 neurons, 3 independent experiments, p < 0.0001. H, Quantification of the percentage decrease in EPSC amplitude after photobleaching (E, G) or waiting period (F). The decrease in amplitude is significantly higher in F-U6-shAtg5-U-Syp-SN-P2A-eGFP-LC3-expressing neurons that were bleached (SC bleached = 11.15 ± 7.261, n = 17 neurons, 3 independent experiments; shAtg5 = 5.74 ± 5.836, n = 16 neurons, 3 independent experiments; shAtg5 bleached = 38.19 ± 5.766, n = 16 neurons, 3 independent experiments, p = 0.0114 and p = 0.0024). Error bars indicate SEM. Paired t test (A–C, E–G) and ANOVA Tukey's multiple-comparisons test (D, H) were used to evaluate statistical significance. *p < 0.05, **p < 0.01, ****p < 0.0001.