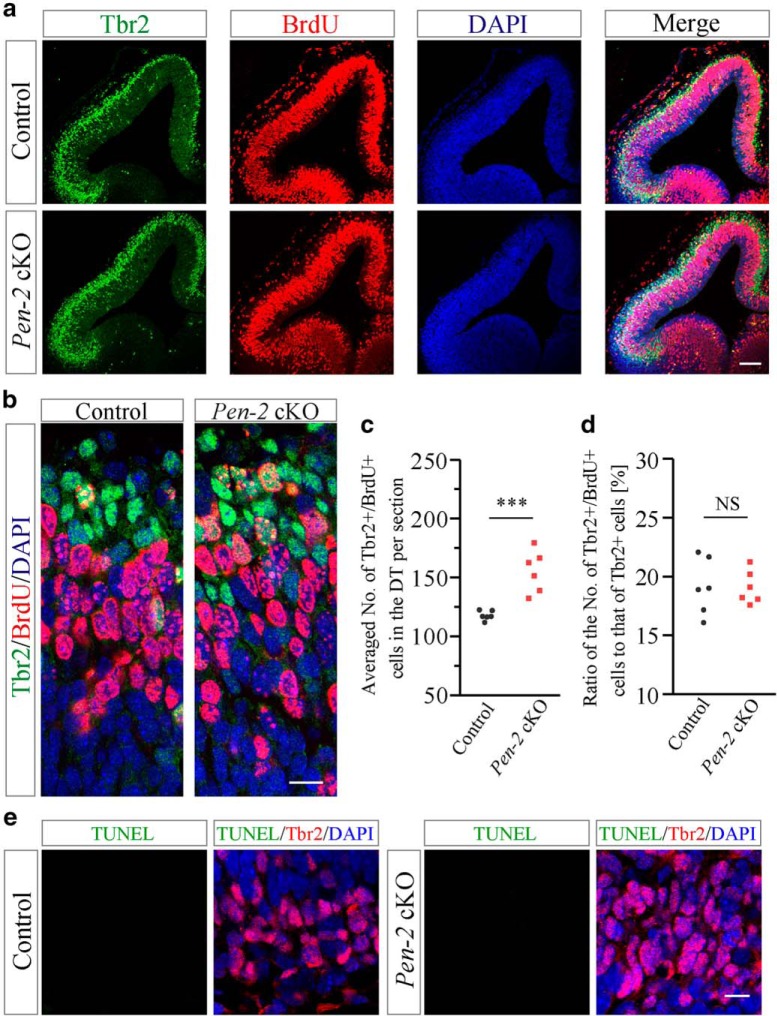
Figure 4.
Unchanged proliferation rate in BPs in Pen-2 cKO cortices. a, Representative images for costaining of Tbr2/BrdU/DAPI. Tbr2+/BrdU+ cells were observed in E12.5 control and Pen-2 cKO cortices. Scale bar, 100 μm. b, Images for costaining of Tbr2/BrdU/DAPI at large scale. Scale bar, 12.5 μm. c, Averaged number of cells positive for Tbr2/BrdU in the dorsal telencephalon per section. There was significant difference on the number of Tbr2+/BrdU+ cells between control and Pen-2 cKO cortices: ***p < 0.005 (n = 6 embryos per group). d, Percentage of Tbr2+/BrdU+ cells to Tbr2+ cells. There was no significant difference between control and Pen-2 cKO cortices (p > 0.9; n = 6 embryos per group). e, Costaining of TUNEL/Tbr2/DAPI using E12.5 brain sections. There were no cells doubly positive for TUNEL/Tbr2 in control and Pen-2 cKO cortices. Scale bar, 10 μm.

