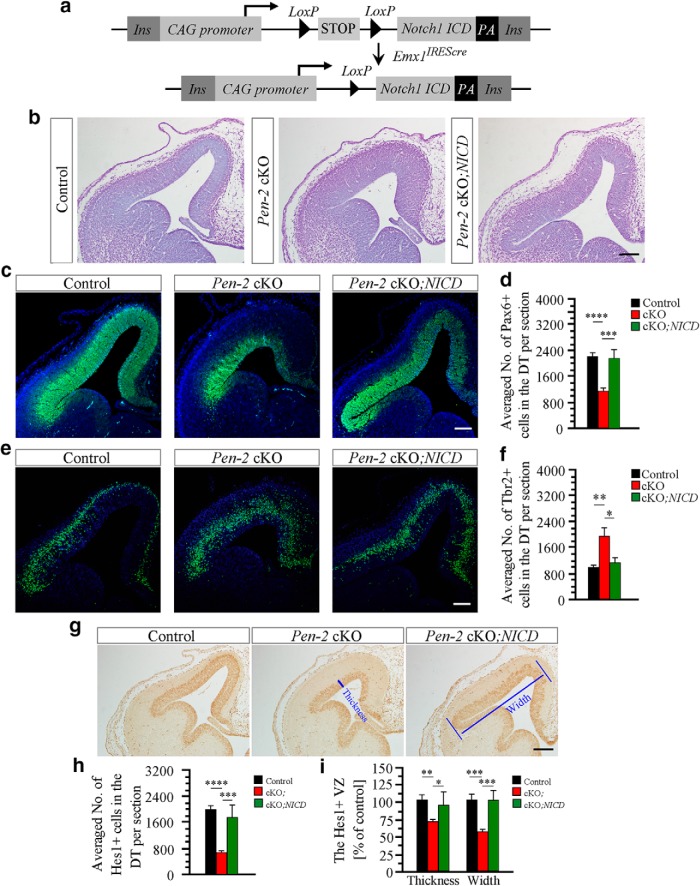
Figure 8.
Restoration of the population for APs and BPs in Pen-2 cKO cortices by NICD. a, Schematic diagram for the generation of NICD cTg (CAG-LSL-N1ICD) mouse. Two loxP sites and the N1ICD sequence were inserted into the construct. Ins, Insulator. b, Nissl staining on brain sections at E13.5. Pen-2f/+;Emx1IREScre;NICD and Pen-2f/+;Emx1IREScre served as the control, as they did not exhibit morphological difference. Pen-2f/f;Emx1IREScre served as Pen-2 cKO and Pen-2f/f;Emx1IREScre;NICD as Pen-2 cKO;NICD. Scale bar, 100 μm. c, Pax6 IHC. The immunoreactivity of Pax6 in Pen-2 cKO;NICD was not different from that in control. Scale bar, 100 μm. d, Averaged number of Pax6+ cells in the dorsal telencephalon per section at E13.5. The difference was not significant between control and Pen-2 cKO;NICD: ***p < 0.005; ****p < 0.001. n = 5 embryos per group. e, Tbr2 IHC. The immunoreactivity of Tbr2 in Pen-2 cKO;NICD was not different from that in control. Scale bar, 100 μm. f, Averaged number of Tbr2+ cells in the dorsal telencephalon. *p < 0.05, **p < 0.01. The difference was not significant between control and Pen-2 cKO;NICD (n = 5 embryos per group). g, Hes1 IHC. The immunoreactivity of Hes1 in Pen-2 cKO;NICD was not different from that in control. Scale bar, 100 μm. h, Averaged number of Hes1+ cells in the dorsal telencephalon. ***p < 0.005, ****p < 0.001. The difference was not significant between control and Pen-2 cKO;NICD (n = 5 embryos per group). i, Thickness and width of the Hes1+ area. *p < 0.05, **p < 0.01, ***p < 0.005. ****p < 0.001. There were no significant differences between control and Pen-2 cKO;NICD (n = 5 embryos per group).

