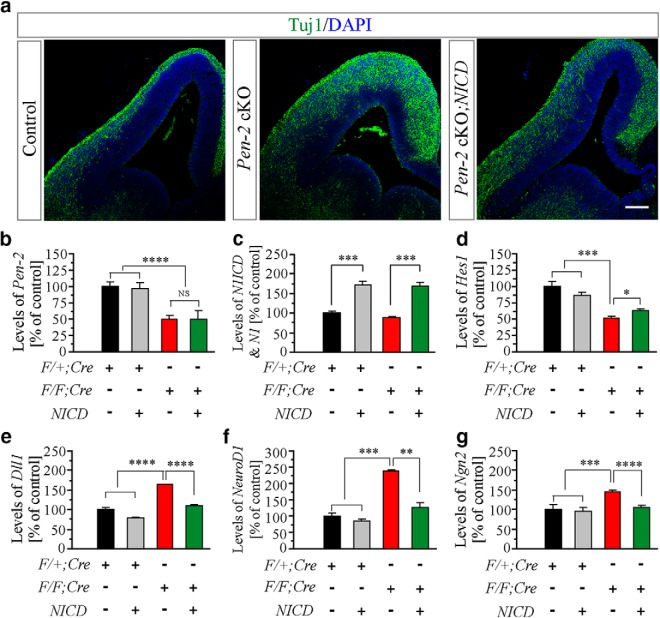
Figure 9.
Rescue effects on expression levels of neurogenic transcription factors in Pen-2 cKO cortices by NICD. Genotype information for different columns (b–g) was as follows. Black column represents the group for Pen-2f/+;Cre (or F/+;Cre). Gray column represents the group for Pen-2f/+;Cre;NICD. Red column represents the group for Pen-2f/f;Cre (or F/F;Cre). Green column represents the group for Pen-2f//f;Cre;NICD. a, Tuj1 IHC. The immunoreactivity of Tuj1 in Pen-2 cKO;NICD was different from that in Pen-2 cKO mice at E13.5. Scale bar, 100 μm. b, RNA levels of Pen-2. RNA samples were prepared from the dorsal telencephalon of mice at E13.5 (4 embryos in each group). There was a significant difference between control and Pen-2 cKO-expressing NICD: ****p < 0.001. There was no difference between Pen-2 cKO and Pen-2 cKO-expressing NICD (not significant, p > 0.2). c, RNA levels of N1ICD and Notch1. There was a significant difference in Pen-2 cKO mice expressing or not expressing NICD: ***p < 0.005. d–g, RNA levels for Hes1, Dll1, NeuroD1, and Ngn2. There were significant differences on Hes1 (d), Dll1 (e), NeuroD1 (f), and Ngn2 (g) between Pen-2 cKO and Pen-2 cKO-expressing NICD: *p < 0.05; **p < 0.01; ****p < 0.001.

