Figure 1.
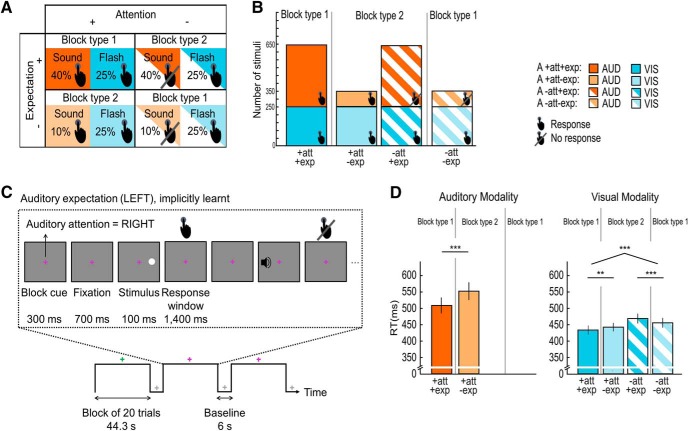
Experimental design, example stimuli of the psychophysics and fMRI experiment and behavioral results of the fMRI experiment. A, The factorial design manipulated: auditory (A) spatial attention (attended hemifield − full pattern, vs unattended hemifield − striped pattern), A spatial expectation (expected hemifield − dark shade, vs unexpected hemifield− light shade) and stimulus modality (auditory modality − orange, vs visual modality − blue). For illustration purposes and analysis, we pooled over stimulus locations (left/right). Presence versus absence of response requirement is indicated by the hand symbol. B, Number of auditory (orange) and visual (blue) trials in the 2 (A attended vs unattended) × 2 (A expected vs unexpected) design. Presence versus absence of response requirement is indicated by the hand symbol. The fraction of the area indicated by the “Response” hand symbol pooled over the two bars of one particular block type (e.g., block type 1) represents the “general response probability” (i.e., the overall probability that a response is required on a particular trial); the general response probability is greater for block type 1 (90%), where attention and expectation are congruent, than block type 2 (60%), where they are incongruent. The fraction of the area indicated by the Response hand symbol for each bar represents the “spatially selective response probability”, i.e., the probability that the observer needs to make a response conditioned on the signal being presented in a particular hemifield; the spatially selective response probability is greater when unattended signals are presented in the unexpected (71.4%) than expected (38.4%) hemifield. C, fMRI runs included 10 blocks of 20 trials alternating with fixation periods. A fixation cross was presented throughout the entire run. The colors indicate as follows: white, fixation period; green or pink, activation period with auditory attention directed to the left (or right) hemifield. On each trial participants were presented with an auditory or visual stimulus (100 ms duration) either in their left or right hemifield. They were instructed to respond as fast and accurately as possible with their right index finger within a response window of 1400 ms. D, Bar plots show response times (across subjects' mean ± SEM) for each of the six conditions with response requirements in the fMRI experiment. The brackets and stars indicate significance of main effects and interactions. **p < 0.01, ***p < 0.001. Audition, orange; vision, blue; attended, full pattern; unattended, striped pattern; expected, dark shade; unexpected, light shade.

